 Equation 1
GNSS modernization includes not only the global coverage capabilities of GPS, GLONASS, Galileo, and BeiDou, but also regional GNSS enhancement systems such as Japan’s Quasi-Zenith Satellite System (QZSS), the Indian Regional Navigation Satellite System (IRNSS), and the European Geostationary Navigation Overlay Service (EGNOS).
GNSS modernization includes not only the global coverage capabilities of GPS, GLONASS, Galileo, and BeiDou, but also regional GNSS enhancement systems such as Japan’s Quasi-Zenith Satellite System (QZSS), the Indian Regional Navigation Satellite System (IRNSS), and the European Geostationary Navigation Overlay Service (EGNOS).
GNSS systems transmit a variety of signals on different frequencies as allocated by the International Telecommunication Union (ITU). Moreover, new signal processing methods for these signals are continuously emerging. Both the actual performance of signals and their processing methods need to be evaluated and confirmed. During the evolutionary period of several of the GNSSs, some of the transmitted signals may be changed during construction, ground operation, and maintenance, evaluation, and testing. Thus, the need arises to ensure the ability to monitor, evaluate, and modify a diverse set of signals and/or processing algorithms.
The major objective of Tsinghua University’s Software-defined Tunable All-GNSS Receiver (STARx) project is to support a new generation of GNSS signal processing capabilities. STARx could be used to optimize system design and algorithm development, including design activities such as signal performance analysis and comparison, processing algorithms development, multi-system concurrent processing, field test, and signal quality monitoring.
Because STARx will need to be able to handle evolving signal design and processing algorithms, it must have a flexible and scalable architecture to facilitate easy integration, replacement, and updating of processing algorithms. The more challenging requirement for STARx is to simultaneously receive all civil signals from the existing and emerging GNSSs in order to support multi-system joint processing research and performance evaluation. Additionally, all of the pertinent intermediate results in the signal processing need to be outputted, displayed, and stored in real-time.
Traditional GNSS receiver architectures that have a high integration density cannot meet the requirement of adaptability and flexibility that would facilitate multi-GNSS signal processing. However, the recent advent of software defined radios (SDRs) offers a great level of flexibility in data processing as well as a low-cost of implementation, requiring only few external components that are easy to change or upgrade for both system designer and user requirements. Until recently, however, SDRs have exhibited relatively low throughput capacity. With the rapid development of microprocessors in recent years, some dual-frequency real-time software receivers have been designed, but for now, the real-time processing of all GNSS signal types across multiple frequencies remains still a challenge.
Some techniques (discussed in some of the articles listed in the Additional Resources section near the end of this article) have been proposed to reduce the computational complexity, such as single instruction multiple data (SIMD) that incorporates bit-wise operation, pre-stored local code, and carrier signal characteristics. However, these inevitably have a tradeoff in terms of accuracy and cannot achieve real-time processing of simultaneous multiple systems over multiple frequencies.
With the rapid development of microprocessor-based graphics processing units (GPUs) in recent years, some software-defined receivers have appeared based on GPU architecture. However, these have not fully exploited the GPU performance because only a few GPU-based algorithms and dual-frequency real-time software receivers have been developed to date. To the authors’ knowledge, no existing SDR is currently able to meet the demands of multiple-signal, multiple-frequency GNSS processing.
In order to support the design, validation, and evaluation of new GNSS signals, as well as algorithm development and signal quality monitoring in our STARx, we use a GPU-based receiver architecture with fully optimized processing algorithms to achieve high processing efficiency without accuracy loss. Currently, STARx can process in real-time all civil signals from the four main GNSS instantiations as well as some of the regional systems, including GPS L1C/A, L2C, L5, and L1C; BDS B1, B2; GLONASS G1, G2; GALILEO E1, E5a, and E5b; and QZSS L1C/A, L2C, L5, and L1C signals.
Based on its flexible software architecture, STARx can easily provide position/velocity/time (PVT), pseudorange, and carrier phase measurements, many intermediate data such as correlator outputs and raw bit stream of each channel, and can be upgraded for new GNSS signals, such as the BeiDou Navigation Satellite System (BDS) Phase III signals and GLONASS-K CDMA signals, quickly after the release of their corresponding interface control documents (ICDs).
Architecture of STARx
A real-time software defined receiver architecture can provide GNSS user equipment with operational flexibility that will prove more and more useful as time goes by. A typical GNSS SDR receiver performs the entire baseband signal processing in the software module. The design framework and algorithms of a GNSS software receiver can be modified easily according to the desired requirements.
Figure 1 shows the block diagram of STARx which contains five main modules: antenna, low noise amplifier (LNA) and down converter, data acquisition card, PC, and remote display and storage.
The design of the hardware, including a front-end module and a general purpose data acquisition card, ensure that STARx can receive the entire frequency band for navigation signals. The received signals are divided into several analog channels to complete down-conversion and sampling. The resulting data is then sent into the PC via a PCI express bus. The rest of receiver functions are completed in a common PC with a GPU.
All the baseband and information processing modules are programmed in C/C++ language and can run in both Windows and Linux systems. Because a modular framework is used in the software design, we can very conveniently add new signals to STARx and adjust its signal-processing algorithms.
Front-End and the Data Acquisition Card
Figure 2 presents the spectrum of existing civil signals. Some signals share the same carrier frequency, which means they can be processed together in the front-end module.
Figure 3 shows the architecture of the STARx front-end and the data acquisition card. A multi-band antenna is used in order to monitor all navigation signals in L-band. The civil signals of the four navigation systems do not share the same center frequency, thus resulting in seven different civil frequencies. After passing through the L-band LNA, the current civil signals are divided into three separate RF channels, the frequency range and signals contained in which are shown in Table 1.
From Table 1 we can see that the input of each analog-to-digital converter (ADC) has a wide bandwidth. In order to simplify the analog intermediate frequency (IF) filter design, we chose a relatively high IF frequency. The data acquisition card used in STARx provides four 12-bit analog input channels capable of simultaneous sampling rates of up to 250 megahertz each, a field programmable gate array (FPGA) in which processing modules can be developed to accomplish digital down-conversion, digital filtering and decimation, and a PCI Express x4 bus interface, which maximizes overall system throughput.
The sampling rate is 120 megahertz, and a decimation filter is used for each signal to reduce the required sample rate. Each navigation signal is transferred into the zero intermediate frequency in-phase and quadrature-phase components with the proper decimation rate. In order to meet the needs of the signal monitoring level, both the in-phase and quadrature-phase components use 8-bit quantization, although this requires greater computational processing and transmission bandwidth.
One of the main factors that affect the performance of software receivers is the sampling rate of the signal. The higher the sampling rate, the more data there is to be processed by the receiver and, therefore, more computer resources are needed. By using our developed flexible configuration digital down-converter (DDC) and the filtering and decimation modules in FPGA, the sampling rate of each signal can be dynamically adjusted in the STARx acquisition card.
We can also configure the signal processing in the PC to adapt to different sampling rates. For example, for the GPS L1C TMBOC (time-multiplexed binary offset carrier) signal, the non-matched process can be used for the narrow-band component with a lower sampling rate when this signal is treated as a BOC(1,1); when demand arises for high performance, the matched process can be used for the wide-band component at a higher sampling rate.
Software Architecture in PC with CPU & GPU
A GNSS software receiver differs from a hardware receiver by performing baseband process in software that runs on a general-purpose microprocessor. As Figure 4 shows, the software architecture can be broken into four main components. First, the acquisition module receives the input data from PCI-E interface, then the GPU is used to find coarse values for code phase and carrier frequency and passes the acquisition result to the tracking module.
The tracking module uses the GPU to accomplish correlation and tracks the code phase, carrier frequency, and carrier phase as they change over time. Then, the navigation message data can be obtained. Finally, we use the ephemeris data extracted from the navigation message to determine satellite visibility, and derive the user position, speed, and so forth. The position results are sent by Ethernet for display and data storage.
As can be seen, the GPU processes the largest part of the calculations, i.e., the acquisition and correlation operation. Separating the processing load into two partitions is the key parameter for determining whether the SDR receiver can achieve high enough throughput to handle many channels in real-time. The following section addresses this question.
Display and Data Storage
A multi-functional, signal monitoring receiver needs a friendly and powerful display interface and data storage for analysis. With Ethernet as an interface, parallel development, remote monitoring, and remote analysis are very convenient. STARx uses SQLite, a widely deployed public-domain structured query language database engine, for data storage and offline analysis.
The database engine stores the data received via Ethernet. This data contains intermediate processing results, such as acquisition information, signal-tracking carrier to noise ratio (CNR), correlation value, visible satellite ephemeris data, raw bit stream, and user position results, with the Ethernet interface facilitating the addition of new monitoring data through this flexible architecture.
CUDA-Based Signal Processing
Compute Unified Device Architecture (CUDA) is a parallel programming model, software environment, and a complete GPU solution that provides direct access to hardware interfaces, without having to rely on the traditional graphics application programming interface (API) functions to achieve GPU access. Using GPUs for data processing is particularly profitable when high amounts of (single precision) data can be processed in a vectorized manner.
One of the first publications describing the use of GPU to process GNSS signals is the article by T. Hobiger et alia, listed in Additional Resources. This work used a GPU card with a 602-megahertz graphics clock and 1296-megahertz processor clock to perform fast Fourier transform (FFT)–based tracking in real-time for nine GPS C/A signals with an eight-megahertz bandwidth. Our previous research presented in C. Wu et alia showed that an GPU card with a 648-megahertz graphics clock and 1,476-megahertz processor clock operating in the time domain could track 150 channels (most of them tracking the same GPS C/A PRN) of a five-megahertz bandwidth signal.
GPU architecture is constantly evolving over time, and the absolute speed improvement is the result of two design aspects: the optimizing algorithm, and upgrading of the hardware. In recent years, GPU performance has been greatly improved, although according to existing literature the calculation capability of the GPU has not been fully tapped yet. For STARx, software optimization is more important. After all, technology development of a software receiver should not completely rely on Moore’s law. Higher execution efficiency means that one can use cheaper hardware to obtain the same performance, and also means that one can save computing resources by using the GPU to do more things with the same hardware.
STARx uses a relatively outdated GPU for gamers that was released two years ago, which is based on a 772-megahertz graphics clock and a 1,544-megahertz processor clock. By using this card, STARx can achieve full L-band GNSS signals real-time processing based on optimized algorithms. (Here are some top priority tips about algorithm optimization: first, using the effective bandwidth of the GPU to determine the upper bound on performance for the kernel; second, minimizing memory transfers between host and device — even if that means doing calculations on the device that are not efficient there; third, combining memory accesses and preferring shared memory access to global memory access; and, finally, trying to avoid code execution branching within a single warp as this serializes the threads.)
Acquisition
The basic theory of acquisition has been discussed in many articles and will not be repeated here. Figure 5 shows the parallel code search architecture, which is very suitable for digital signal processing. The coherent integration is the product of the two discrete Fourier transforms of the sampled received signal and the code replica:
z(n) = IFFT{FFT[x(n)] • FFT* [y(n)]}
Further non-coherent integrations are obtained by summing the squared magnitudes of coherent correlation values. At this point in the discussion, it is appropriate to identify constraints in the processing algorithm. The first is the multiplication of the two spectra including the circular vector shift. This function is easily implemented in CUDA for parallel realization. The second constraint is the Inverse FFT (IFFT) operation. Here the CUDA FFT (CUFFT) library is used, which allows STARx to run several IFFTs in parallel. The third constraint is the non-coherent addition and the calculation of the maximum. These steps are also performed on the GPU by hand-coded CUDA kernels.
Following the identification of these three constraints, all three processes were ported from the CPU to the GPU. We subsequently tested two algorithms (spectra multiplication and IFFT operation) on a PC equipped with an eight core, 3.50 GHz Intel i7-3770K CPU. Furthermore, the PC is equipped with a graphics card with 16 multiprocessors and 512 cores running at 1.5 GHz.
The CPU algorithm uses the FFTW C subroutine library to calculate FFT and IFFT operations, and the GPU algorithm uses CUDA to mitigate the three constraints. Table 2 shows the acquisition time of the CPU and GPU acquisition algorithms. The test signals used are GPS L1C/A and L1C, which are two completely different modulated signals.
From the results in Table 2, one can clearly see that, after the use of the GPU, the computational efficiency has been significantly improved and the computation time reduced by a factor of 10. One can also see that, for the GPS L1C signal with a 10-millisecond coherent integration interval, the CPU algorithm is unable to achieve real-time acquisition. STARx uses the GPU to complete acquisition, where its high computational efficiency is a key point for the full-band real-time software receiver.
Correlation
Figure 6 shows the conventional code and carrier tracking loops. For some new signals, such as Galileo E1, in order to eliminate the code tracking ambiguity, the number of correlators should be increased. However, we do not need to change the total architecture to accomplish this.
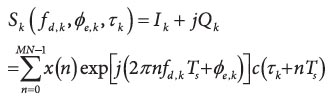
In GNSS signal processing, code phase and carrier phase estimations are based on correlation of the received signal with local replica signals:
Equation 1 (see inset photo, above right)
where,
Sk(∙): despread signal in the k-th satellite
fd,k: Doppler frequency in the k-th satellite
ϕe,k: carrier phase error in the k-th satellite
τk: code phase error in the k-th satellite
Ik: in-phase despread signal in the k-th satellite
Qk: quad-phase despread signal in the k-th satellite
x(n): received signal
M: coherent integration time
N: block division parameter
Ts: sampling interval.
Signal correlation consists of two operations: multiplication of two signals and accumulation of the result, as shown in Figure 7. This is the largest computing workload in the receiver and in a classical CPU-based receiver is accomplished by going through the data step by step, alternating multiplication and adding. In the past few years, some techniques have been proposed that can be used to reduce the computational complexity of correlation, such as SIMD, OpenMP, bit-wise operation, and pre-storing local files with multiple different phase-shifts.
The basic ideas of optimization based on single-instruction, multiple-data (SIMD) computing and the OpenMP API are similar to GPU optimization, but obviously the GPU has more cores and higher efficiency. As previously mentioned, to avoid performance loss, STARx uses eight-bit quantization in the ADC module; so, the bit-wise algorithm is not suitable for our receiver. The pre-stored local code and carrier signals methods have a tradeoff in terms of speed and the quality of the code and phase measurements, which cannot match the demand for high-precision signal quality monitoring.
An efficient way to correlate two signals by using the GPU is to first multiply both signals and accumulate them afterwards. The multiplication of two data arrays is perfectly suitable for vectorization, where it can be done in one parallel processing step.
The accumulation of a data array needs more steps as the array needs to be reduced step by step to a single value. An efficient way to do this on a parallel processor is to use the so-called “parallel reduction” technique, in which the number of values is reduced by a factor of two in each processing step. A data array with the length N can therefore be accumulated in log2N processing steps.
In addition to these optimization steps, a large number of detail optimizations are also necessary. For instance, maximizing the use of cache in the core in the Fermi architecture, avoiding warp divergence and avoiding failures of branch prediction, and so on.
A similar test environment as in acquisition was used to test the two tracking algorithms. The SIMD, pre-stored local code and carrier signals methods have been employed in the CPU algorithm to improve computing performance. Table 3 shows the tracking results of CPU and GPU comparison. The test signals were the GPS L1 C/A and Galileo E1 and E5a, which are also three differently modulated signals.
In order to track the Galileo E1 signal, five correlators were used for the BOC modulation. As reflected in Table 3, the GPU algorithm has no advantage when tracking one channel and is even worse than the CPU algorithm. But for 12 channels, the computational efficiency has been significantly improved and the computation time reduced by three to eight times. This is mainly because, for one channel, most of the time is consumed by the exchange of computer memory and video memory.
Moreover, we also can see that for the GPU algorithm, the time required to tracking 12 channels is not much greater than when tracking 1 channel. This is because the GPU resources are not fully used in parallel.
After correlation, data throughput is significantly reduced, and many conditional branches are not suitable for the GPU to process. Therefore, the loop filters, message extraction, and position-determining modules are all completed by the CPU in the current version of STARx.
Experiment Results
Figure 8 shows the diagram of each part of the receiver, the antenna, analog down-converter, data acquisition card, PC with GPU card and the GUI display driver. In order to have enough extensibility to run more advanced algorithms in STARx, the hardware selection has a great deal of excess capability. For an instance, real-time tracking of all navigation signals only takes up about two to five percent of the CPU time.
From Figure 8 we can see that the actual signal data or IF sampling data can be directly used by the receiver for real-time processing or post-processing, and the RINEX file and NMEA file can be exported during signal and information processing, which is very suitable for follow-up observations and analysis. In our test, the antenna was located on the roof of the Weiqing Building of Tsinghua University in Beijing at latitude and longitude coordinates 116.330361 N and 40.001501 E.
Real-Time Tracking of All Navigation Signals
In order to test real-time tracking for all navigation signals, the STARx receiver is configured to run 10 different signals (GPS L1C/A, L2C, L5; BDS B1, B2; GLONASS G1, G2; and Galileo E1, E5a, E5b) and 12 channels per signal simultaneously. In cold start configuration, the receiver will automatically search and track all of the visible satellites. The remaining channels will continuously try to capture signals to ensure that STARx can immediately track a new satellite when it appears. The number of channels for each signal can be flexibly configured; 12 channels are enough for most signals.
By the time of the test period, the Galileo system had launched only four operational satellites, which could be seen only during a specific periods of time. The first experiment time we selected was 6:10 a.m. (Beijing time) on May 8, 2013, when the four Galileo satellites were visible and numerous other GNSS satellites at the same time.
Figure 9, a screenshot from display interface, shows the skyplot of the 31 satellites being tracked at that moment, including 10 GPS satellites (green), 10 BDS satellites (red), 4 Galileo satellites (yellow) and 7 GLONASS satellites (blue). The only QZSS satellite in operation, with 193 PRN number, is included as a GPS satellite because it broadcasts GPS-like navigation signals.
Figure 10 provides the position dilution of precision (PDOP) values of the four systems individually and combined. One can clearly see that, compared to GPS, the PDOP values of the other three systems are large, which would result in greater position errors. However, by combining satellites from the four systems, the PDOP value is the smallest and close to 1, which to a certain extent can reduce positioning error.
With the display interface and the data storage, the real-time tracking state for each channel of all signals can be seen during the signal processing, including the CNR, carrier Doppler, in-phase, and quadrature-phase correlation values, and so forth. Because acquisition and correlation operations are processed by the GPU, during the testing process the CPU occupancy rate is very low, only about two percent.
Positioning Test Results
This section will present and discuss navigation signal positioning results. Due to the influence of variable factors such as the ionosphere, the deviation of each satellite signal’s positioning result is different. In order to compare the positioning performance in the results, therefore, the positioning deviation of each signal has been manually adjusted to a zero mean.
The experiment positioning results of the Galileo E1, E5a, and E5b signals are showed in Figure 11. According to the results, the Galileo satellite signals have been tracked and message extraction completed. Figure 12 shows the skyplot of Galileo satellites, and the PDOP value is 11.37 which is very poor, but we have no other choice as only four Galileo satellites are presently in orbit.
Figure 13 shows the positioning results of each Galileo signal. We can be see, with faster pseudo-code rate and wider bandwidth, the E5a and E5b signals have better RMS positioning accuracy than the E1 signal.
On May 30, 2013, the U.S. Air Force Space Command released the Global Positioning System Modernized Civil Navigation (CNAV) Live-Sky Broadcast Test Plan, which announced that the GPS would have a live-sky test for the CNAV from June 15 to June 29. During this time, STARx was successful in capturing the L2C and L5 signals and in achieving positioning by using each signal alone.
During the test period, four Block IIF satellites transmitted the L5 signal, but only three satellites were visible at the same time, which was not enough to achieve three-dimensional positioning. Fortunately, the only QZSS satellite in operation — which can broadcast GPS L2C and L5, as well as L1 signals — is visible more than 20 hours each day in Beijing. Added to the three GPS satellites, the QZSS signal completed the minimum constellation needed to achieve three-dimensional positioning.
The GPS/QZSS observations started at 8:34 Beijing time on June 19, 2013. Figure 14 shows the positions at the time of acquisition of the three GPS satellites — with PRN numbers 1, 24, 25 — and of one QZSS satellite with the PRN of 193. The PDOP value is 2.38, which is better than the test for Galileo signals, but three low-elevation satellites in the configuration would have some effect on the positioning results (See Figure 15).
Figure 16 shows the RMS positioning error with the L5 single frequency in the test. As there are only four satellites, including low-elevation satellites, the positioning results are not very good.
The observations began at 23:43 Beijing time on June 18, 2013, for the L2C signal. Figure 17 and Figure 18 show the tracking states and skyplot of the L2C signal. Figure 19 shows the RMS positioning error with L2C single frequency in the test. The positioning results are relatively poor due to the small number of satellites and the relatively low code rate of L2C.
For the next test, BDS and GLONASS signals were added, and the positioning experiment began at the same time as the first tracking test: 6:10 a.m. Beijing Time on May 8. (Refer again to the Figure 9 skyplot for the positions of visible GLONASS and BDS satellites.)
Figure 20 shows the positioning results of BDS B1, B2 and GLONASS G1, G2 signals. These two signals of both systems have similar positioning accuracy for they have the same modulation and code rate. Because of the higher bit rate, for single-frequency positioning the BDS signals have better accuracy than GLONASS signals.
Signals Monitoring
Figure 21 shows the satellite CNR results of four navigation systems during 20 hours of observations in Beijing. For the GPS system, in the test period more than 30 satellites were observed. Generally speaking, according to the different satellite orbits, the visible time of each satellite ranged from 2 to 10 hours, which can be clearly seen in Figure 21.
The black line in the GPS chart, indicating more than 14 hours, is the QZSS satellite, which is not in medium earth orbit. For the BDS system, the signals that can be seen all the time are from the five geostationary satellites. The GLONASS monitoring results are almost the same as GPS. For the Galileo system, Figure 21 indicates that, the time in which four satellites can be seen simultaneously is between 2 to 3 hours. Only during this period, could we implement the positioning test for Galileo.
STARx Signal Processing during Tests
During the tracking process, STARx clearly displays the prompt, early, and late in-phase correlation value of each signal along with the signal tracking status. In the display interface, the three correlation values can be shown in real-time. Figure 22, a screenshot for the GPS L1C/A signal, provides an example. As can be seen from Figure 22, when using the wide E-L spacing, the prompt result is significantly larger than either the early and or late results, which means the tracking loops are in good condition. Meanwhile, the raw bit stream can also be clearly seen from the prompt result.
Because the computational load of correlation has been significantly optimized in STARx, hundreds of correlators can work simultaneously in real-time mode. It is easy to assign a dozen correlators to one channel for real-time measuring of signal correlation peak shape. Figure 23 shows the correlation peak shape monitoring results for BDS B1 and Galileo E1 signals, which adopt bi-phase skip keying (BPSK) and composite binary offset carrier (CBOC) modulations, respectively. As can be seen from the Figure 23, when the tracking loops are in steady state, the BPSK signal has the autocorrelation peak of the triangle and the autocorrelation of the CBOC signal shows side peaks.
Conclusions
This article has presented and discussed the novel, efficient GPU-based channel-processing method and flexible receiver architecture of STARx, a high-flexibility, multi-system full-band, real-time GNSS software defined receiver. In the current version of STARx, all civil signals from the four main GNSS instantiations and some of the regional systems can be processed in real-time.
Experimental results showed the real-time tracking of all navigation signals, the positioning results of each signal, the satellite monitoring results, and the correlation-value monitoring results of BPSK and BOC signals. The STARx design is also easy to upgrade for new navigation signals like BDS Phase III signals and GLONASS-K CDMA signals.
In future studies, STARx will be used as a development platform for various types of navigation research. For example, testing and validating algorithms of multi-mode, multi-band operation can be implemented to enable the receiver to process many signals on multiple frequencies, as well as interoperability and compatibility research.
Acknowledgment
This article was adapted from a presentation given by the second author at the ION GNSS+ 2013 conference on September 19, 2013, hosted by the Institute of Navigation in Nashville, Tennessee, USA. The authors would like to thank Mr. Dongkai Sun and Mr. Tengfei Wang for their assistance in development of STARx, and Prof. James Torley at the University of Colorado at Springs for his useful suggestion.
Additional Resources
[1] Capua, R.,and A. Bottaro, “A GNSS Software Receiver for Governmental Applications,” Proceedings of ION GNSS 2011, pp.813–823, September 20–23, 2011
[2] Charkhandeh, S. , and M. Petovello and G. Lachapelle, “Performance Testing of a Real-Time Software-Based GPS Receiver for x86 Processors,” Proceedings of ION GNSS 2006, pp. 2313–2320, September 26–29, 2006
[3] Chen, Y-H., and J-C. Juang, D. De Lorenzo, J. Seo, S. Lo, P. Enge, and D. Akos, “Real-Time Dual-Frequency (L1/L5) GPS/WAAS Software Receiver,” ION GNSS 2011, pp.767–774, September 20–23, 2011
[4] Haak, U., and H-G. Bsing and P. Hecker, “Performance Analysis of GPU-Based GNSS Signal Processing,” Proceedings of ION GNSS 2012, pp. 2371–2377, September 17–21, 2012
[5] Hobiger, T., and T. Gotoh, J. Amagai, Y. Koyama, and T. Kondo, “A GPU-Based Real-Time GPS Software Receiver,” GPS Solutions, vol.14, pp.207–216, 2010
[6] Huang, B., and Z. Yao, F. Guo, S. Deng, X. Cui, and M. Lu, “STARx — A GPU Based Multi-System Full-Band Real-Time GNSS Software Receiver,” Proceedings of ION GNSS+ 2013, pp.1549–1559, September 16–20, 2013
[7] Im, S-H., and B-H. Lee, G-I. Jee, E-S. Lee, M-B. Heo, “A Software-Defined Real-Time GNSS Signal Quality Monitoring Receiver using GPU (Graphic Processing Unit),” Proceedings of ION Pacific PNT 2013, pp.1067–1073, April 23–25, 2013
[8] Ledvina, B., and S. Powell, P. Kintner, and M. Psiaki, “A 12-Channel Real-Time GPS L1 Software Receiver,” Proceedings of ION NTM 2003, pp.767–782, January 22–24, 2003
[9] Pany, T., and B. Riedl and J. Winkel, “Efficient GNSS Signal Acquisition with Massive Parallel Algorithms Using GPUs,” Proceedings of ION GNSS 2010, pp.1889–1895, September 21–24, 2010
[10] Wu, C., and Y. Qian, X. Cui, and M. Lu, “The Optimized Method and Algorithms in the CPU&GPU-Based GNSS Software Receiver, Proceedings of ION GNSS 2009, pp. 339–343, September 2009
