Rightfully, the GNSS community almost universally considers reflected signals to be problematic (the field GNSS reflectometry being an obvious exception). Reflected or non-line-of-sight (NLOS) signals combine with line-of-sight (LOS) signals to produce multipath effects, or if the LOS signal is absent NLOS signals can produce large ranging biases. Both phenomena increase measurement error and decrease positioning accuracy, especially in areas with lots of reflecting surfaces such as deep urban canyons.
Dealing with NLOS-only signals is generally easier than dealing with multipath because the errors tend to be larger and are thus easier to detect with standard receiver autonomous integrity monitoring (RAIM) approaches. More recently, ray tracing has been used in combination with 3D building models (3BDM) to predict and correct NLOS-only signals for their path delay, thus making them behave more like LOS signals.
In contrast, multipath — which we herein use exclusively to represent the contamination of the LOS signal, if it is present — is more difficult to deal with because the errors are smaller and harder to detect with RAIM. More importantly, even if the path delay of contaminating NLOS signal is known or can be computed, the relative carrier phase of the LOS and NLOS signal(s) can cause the resulting pseudorange measurement to appear too short, even though the NLOS signal is always, by definition, delayed relative to the LOS signal. Predicting the carrier phase(s) of the NLOS signal(s) relative to the LOS signal is generally not possible with sufficient accuracy due to the relatively short wavelength of GNSS signals involved (a 30 degree phase accuracy would require relative position accurate to better than 2 centimeters at L1).
However, most of the above problems arise from the fact that positioning algorithms typically assume their input to be measured pseudoranges. If we instead consider the input to be the receiver’s correlator outputs (which are used to compute the pseudorange), then entirely new options are possible. This article discusses one approach for combining correlator outputs with 3DBM data to derive position from only reflected signals. In essence, it demonstrates that when handled properly, reflected signal can actually be useful.
High-Level Concept
Before delving into some of the details of how NLOS signals can be used constructively, we first introduce some key concepts.
First, let’s assume we have a candidate value of the user’s position. We will discuss how such a candidate value might be obtained later in the article, but for now we simply assume it is available.
Next, we use the candidate position along with a 3DBM and ray tracing techniques to compute/predict two important pieces of information: (i) the number of received signal paths (LOS and/or NLOS); and (ii) the path delay of each signal relative to the LOS signal, regardless of whether the LOS signal is actually present. Collectively, these values are referred to as the “predicted signal parameters”. Note that the algorithm does not require that the LOS signal be present — if it is, its path delay will be zero, by definition.
Not requiring the LOS to be present is one of the main advantages of our approach because, especially in urban areas, LOS signals are not always received. If the LOS signal is absent, then the path delay relative to the shortest received NLOS path can be computed as
![]()
where is the path delay of signal b relative to signal a, and NLOS1 is the shortest NLOS signal and NLOS2 is the second-shortest NLOS signal.
Third, we perform a comparison between the predicted signal parameters and the received signal parameters. The latter are not known directly, but are completely contained in a GNSS receiver’s correlator outputs. If the predicted signal parameters agree with the correlator outputs, it suggests that the candidate position used to generate the predicted parameters was accurate. In contrast, if the agreement between the predicted and received signal parameters is poor, it suggests the candidate position was inaccurate.
This final point suggests that instead of a single candidate position, several candidate positions should be considered and the position whose predicted signal parameters best match the correlator outputs should be selected as the final position estimate. This is precisely how the algorithm works — we use a grid of candidate points as the input and select the “best” amongst these as the final position estimate (how we obtain a grid of points is discussed later).
Filling-In Some Details
Although a full mathematical description of the algorithm is beyond the scope of this article, some key details are described in this section to better explain what is happening. The Additional Reading section at the end of the article provides resources containing more of the mathematical details.
One of the more important aspects of the algorithm is the development of mathematical models of the correlator outputs that relate to the predicted signal parameters. Based on our empirical observations, we only considered one-, two- and three-path models for the correlator outputs, but additional paths could be included if necessary. For illustrative purposes, we only show the two-path model:

where is the power of the correlator output; subscripts denote the shortest, second-shortest, etc. signal paths; A is the signal amplitude; τ1 is the code phase of the shortest path; бτ is the path delay as defined above; R(τ) is the auto-correlation function of the signal’s ranging code; and бϕ is the relative carrier phase. Although we model the correlator power, similar models could be derived for in-phase (I) and quadrature-phase (Q) signals.
The parameterization above intentionally includes the path delay which, as discussed above, can be obtained from ray tracing and a 3DBM. More specifically, it allows the predicted path delay values to be used as input to the signal model.
This leads to the final step, which is the comparison of the predicted signal parameters to the received signal parameters. This is accomplished using a least-squares fit of the correlator outputs to the selected signal model. The state vector used for the two-path case is

The solution is computed using the predicted path delays as a priori information, meaning the least-squares estimator is primarily estimating all of the other (nuisance) parameters. The astute reader will notice the absence of an explicit clock term — this implicitly contained in the code phase for shortest received signal (τ1).
As mentioned above, if the candidate position is accurate, the predicted path delays will also be accurate and the estimator should be able to reliably estimate the remaining signal parameters. The corresponding least-squares residuals should be small. In contrast, an inaccurate candidate position will lead to larger residuals. This works because of all of the parameters in the state vector, the one most sensitive to the input candidate position, is the path delay.
In light of all this, the root-sum-squares (RSS) of the residuals is the metric used to assess the goodness of fit of the predicted signal parameters to the correlator outputs (smaller is better). More specifically, the process described above is performed separately for each satellite and the RSS residuals across satellites is used as the final metric.
Over-parameterization of the signal model must be accounted for when computing the residuals for each satellite. This can happen when the predicted number of paths is larger than the number of paths actually received. In this case, the “extra” degrees of freedom in the model will artificially reduce the RSS of the residuals. When an over-parameterization is detected, the RSS residuals are set to be large to effectively de-weight the corresponding candidate position — this makes sense as the predicted signal parameters are effectively wrong, most likely because of an inaccurate candidate position.
Before showing results, it is worth noting the receiver’s correlator taps should span a sufficiently wide range of code phase values and use a sufficiently tight spacing so as to capture enough of the received signal’s “shape”. In our work, we used 61 correlator taps equally spaced across ±1 chips.
Results
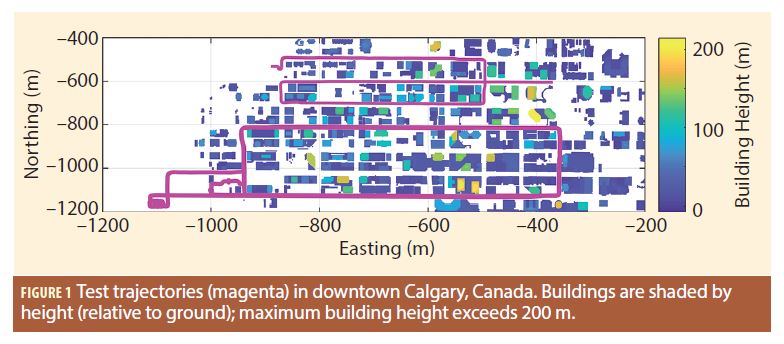
Data was collected in downtown Calgary, Canada on two separate days over a total of about 50 minutes. Figure 1 shows the trajectories of the two data sets in purple along with building outlines colored by building height. The tallest building exceeds 200 meters and there are parts of the trajectory where the sky visibility falls below 20%. This is therefore a relatively challenging environment for GNSS-based positioning.
Data was collected using a front-end and processed using a software receiver to generate correlator outputs. For the results shown, the coherent integration time was 10 milliseconds and no non-coherent summation was performed. Such short coherent integration times would support snapshot based positioning, wherein a short period of data is recorded and used to compute a solution. In turn, this can offer tremendous power savings over “fully-tracking” receivers.
The correlator outputs and a 3DBM were then input into Matlab, where the algorithm described above was implemented. The computed positions were derived using the above algorithm only. In other words, only reflected signals were used, no LOS pseudoranges. This was done to directly assess the feasibility of using reflected signals for position determination. The computed positions were then compared against a GNSS/INS reference solution to assess performance.
To best analyze results, Figure 2 shows a box-and-whisker plot of the horizontal position errors binned according to sky visibility. The most striking result is that accuracy improves as sky visibility decreases. This happens because reduced sky visibility implies more NLOS signals, and since the algorithm only uses NLOS signals, it follows that results should improve in this case. Equally surprising is that for sky visibilities below 20%, the median error (denoted by red line) is only about 3 meters. Finally, the spread of the data in each bin indicates the results are repeatable between tests and at different locations along the trajectories.
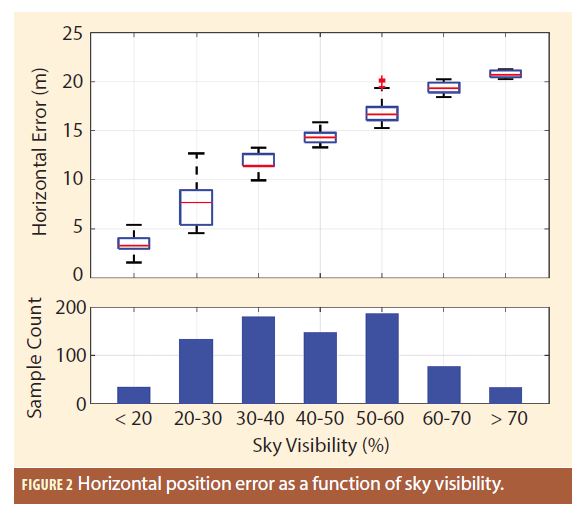
As an extension of the above results, as sky visibility increases, the positioning error increases because there are fewer NLOS signals the algorithm can use. This behavior would change if LOS pseudoranges were used.
Discussion
Although the results presented are promising, the algorithm does have its drawbacks. The most obvious drawback is the need to perform ray tracing, which is computationally intensive, especially for power- and/or resource-constrained platforms. Use of a graphics processing units (GPU) could improve processing throughput, as could offline processing, but each of these approaches pose challenges of their own.
The other drawback is initialization of the algorithm. Until now, we have assumed that a grid of candidate positions is available without consideration for how that may be obtained. Our research has demonstrated that the algorithm described above is robust to large uncertainty regions (with corresponding computational challenges) suggesting that a “standard” GNSS position could be used with a sufficiently conservative uncertainty region. However, further investigation would be necessary to verify this under a wide range of operational conditions.
Notwithstanding the above challenges, using NLOS signals to improve positioning performance has been demonstrated and it will be exciting to see how this emerging area of research and development evolves.
Additional Reading
More details on the algorithm described above is available here:
Kumar, R. and Petovello, M.G. (2017) “3D building model-assisted snapshot positioning algorithm”. GPS Solutions, 21(4), 1923–1935.
Kumar, R. (2017) “3D Building Model-Assisted Snapshot GNSS Positioning”. PhD Thesis, Department of Geomatics Engineering, University of Calgary, Calgary.
Authors
Rakesh Kumar received a PhD degree from the University of Calgary where he worked on improving GNSS-based navigation in urban canyons and integration of 3D city models with GNSS. Prior to this, he completed his bachelors and masters in electrical engineering from India and had more than 10 years of experience in the aerospace industry. Currently he works in systems engineering for the active safety and automated driving division of General Motors.
Mark Petovello, co-author, is the editor of this column.


