
An assisted GPS direct positioning estimation (DPE) technique for urban environment copes with a full spectrum of direct-line-of-sight and non-line-of-sight or multipath conditions. A new approach using signal visibility and specular reflection predictions within the DPE shows the potential to reduce positioning error from approximately 30 to 10 meters.
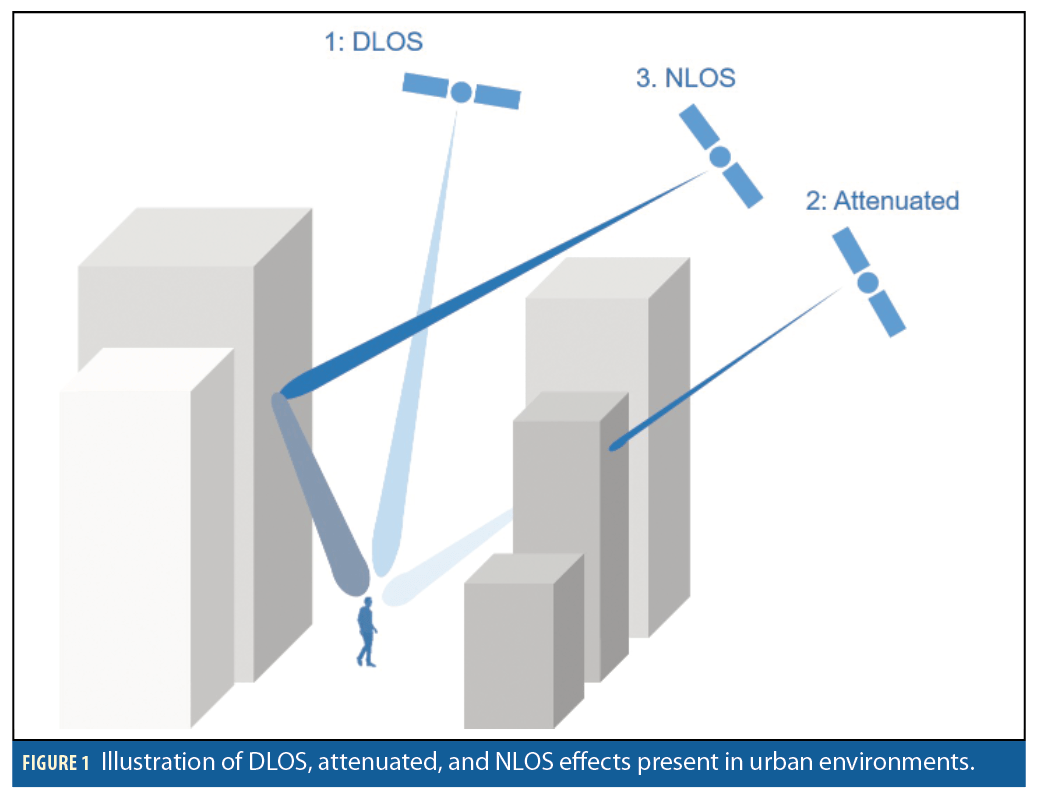
Additional knowledge in challenging urban environments can improve an otherwise degraded position solution. Tall office buildings pose problems for GPS positioning as they obstruct the direct line-of-sight (DLOS) visibility to satellites, and additionally give rise to non-direct line-of-sight (NLOS) signals or multipath (Figure 1).Our work explores how predictions of these paths can be efficiently incorporated in a direct positioning estimate (DPE) solution.
Direct Positioning Estimation
In the challenging environment of a dense urban area, conventional GPS positioning is not reliable. In urban environments where many of the received signals from satellites are degraded, if the region of interest is sufficiently small, and the user can approximate the receiver clock error, the method of collective detection using a direct positioning estimator (DPE) can increase acquisition sensitivity.
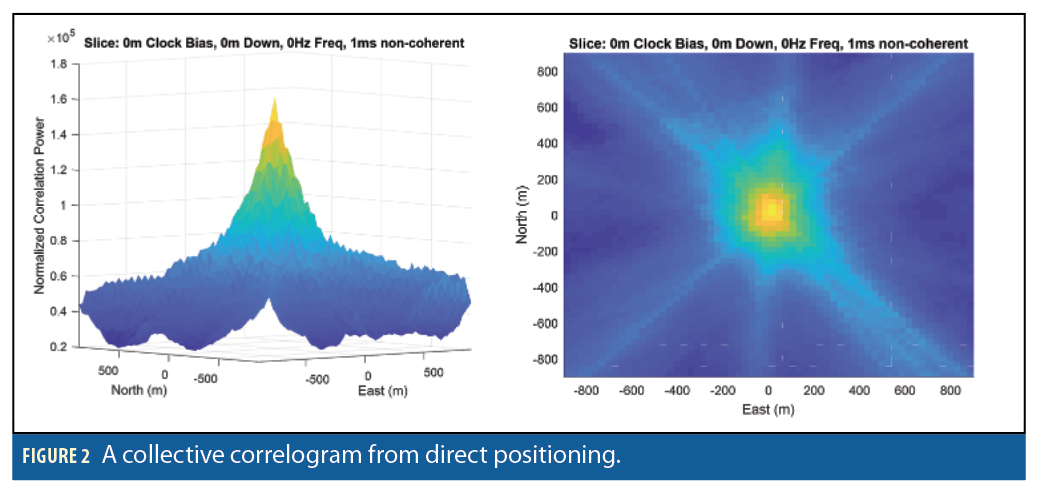
In contrast to the conventional two-step method, in which a small number of correlations drive the steering of the correlators and a position estimate results from pseudorange and Doppler measurements, DPE forms a position estimate directly from the satellite correlograms. Using a priori information about the GPS satellites, user location and clocks, DPE constructs a multidimensional spatial correlogram, combining the correlation values for individual satellites. In our implementation of DPE we first compute the individual satellite delay-Doppler correlograms, then map their values onto a spatial grid of candidate position solutions. Adding the contributions produces a composite spatial correlogram that is evaluated to find the most likely position. For urban positioning, by constraining solutions to the Earth surface and pulling out the most likely user clock bias and frequency values, the spatial correlogram can be displayed on a 2D North-East grid (Figure 2). In addition to showing the peak value corresponding to the most likely user position, the features of the correlogram image also provide insights into the quality of the solution.
DPE is particularly well-suited to the urban position problem because a) an a priori position can be readily established; b) continuous signal tracking is not required; and c) signals too weak to be tracked independently can still contribute to the solution. Our urban DPE approach has the added benefit of being able to incorporate building blockage and reflection predictions to essentially take advantage of the benefits of both DPE and specular matching techniques.
Our research uses knowledge of the surrounding urban environment to enhance the DPE positioning technique. The method incorporates the measured signal characteristics into the DPE correlogram based on visibility and specularity predictions. This allows us to leverage information about blocked satellites and reflected signals in the DPE.
Data Collection
To investigate the signal environment in an urban setting, we collected four data sets within the city of Denver, CO.
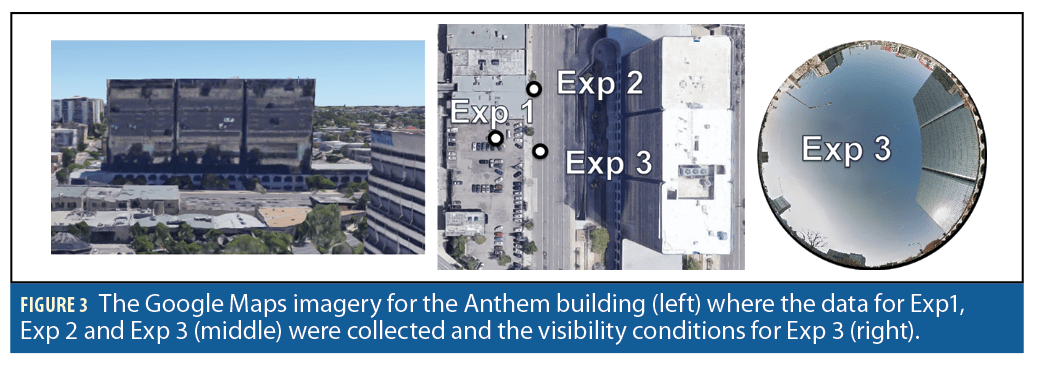
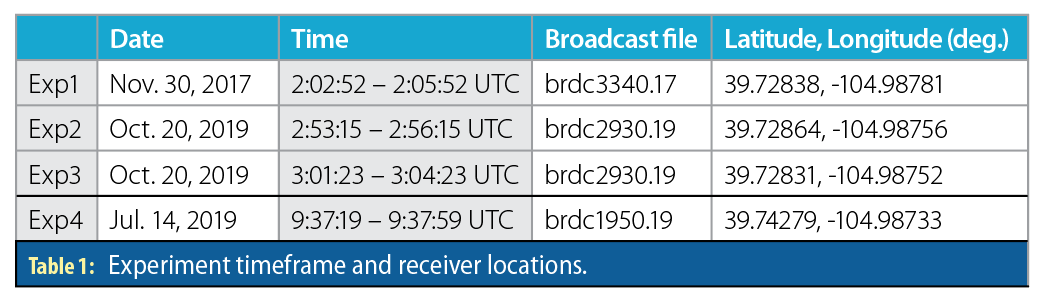
Locations. For the first location, the city-block that contains the Anthem Blue Cross-Blue Shield Building was selected. The broad, high-rise Anthem building guarantees a likely reflection for specific satellite geometries shown in Figure 3. Three data sets (Exp1, Exp2, and Exp3) were collected at positions directly to the west of the Anthem building at times when a GPS satellite (PRN 7) was expected to be at a low elevation (~25 degrees) in the western region of the sky.
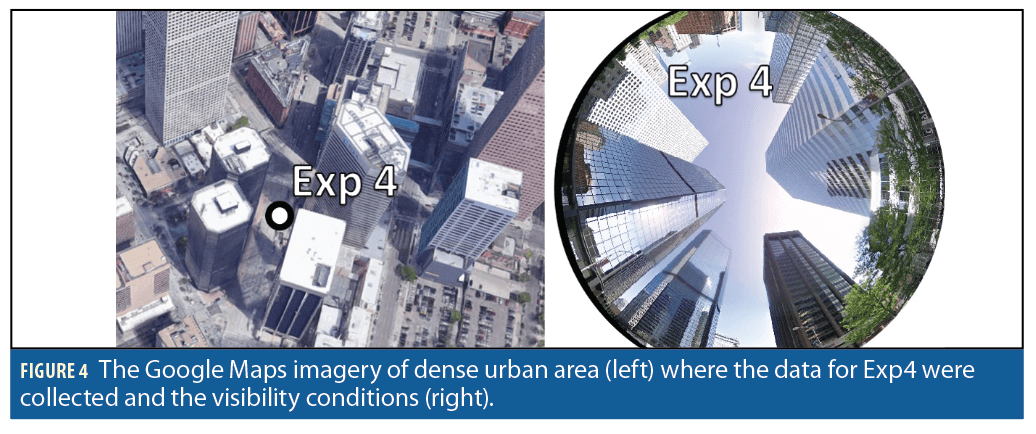
In Exp1 and Exp3 we expect to see an unobstructed DLOS to satellite PRN 7. However, in Exp2 a small building directly to the west is expected to block the DLOS to satellite PRN 7. For the fourth data set (Exp4), a location surrounded by tall, densely-packed, glass buildings was chosen where the open sky visibility is low (Figure 4).
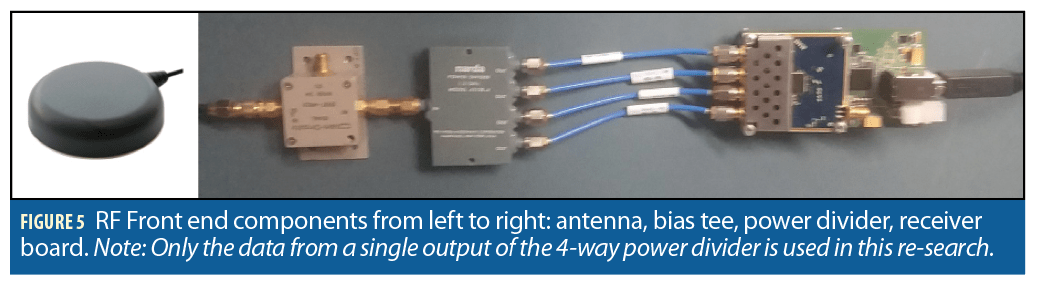
Data Loggers. To implement the DPE in a software defined radio (SDR) we require raw sample data to be gathered with a high-speed data logger. The equipment is shown in Figure 5. The signals are sampled at 53 MHz and streamed from the RF front end through a USB connection to a laptop.
Method
To address the challenges of providing accurate and reliable GPS-based position solutions in an urban environment, we have developed a variety of algorithms within a flexible software framework and tested their performance on data sets including those described in the previous section. Here we introduce specific DPE estimation methods suitable for implementation on an SDR that account for limited visibility and specular reflections due to buildings.
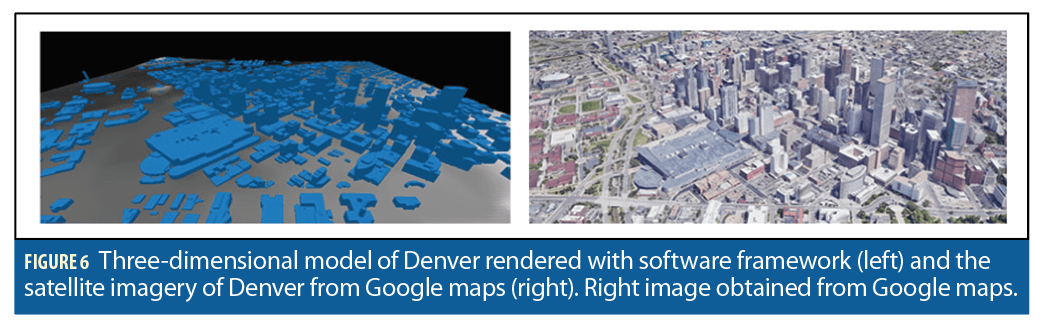
Software Framework. In 2016, the Denver Regional Council of Governments used aerial imagery to create the delineation of building footprints in Denver and nearby regions. The building footprints included in the dataset have a building top area of at least 48 square feet, at a height of over 5 feet. The data has a 3-inch resolution and a 6-inch RMSE accuracy. From these data sets, we create 3D triangular meshes defined in an east-north-up coordinate system such that the terrain structure and building model are optimized to support efficient ray tracing using rendering tools from the physically-based ray tracer (PBRT) software package (Figure 6). The terrain and 3D building faceted models can be quickly ray-traced in the form of a k-d tree, which achieves a search time complexity of O(log n ) on average for n facets in the scene.
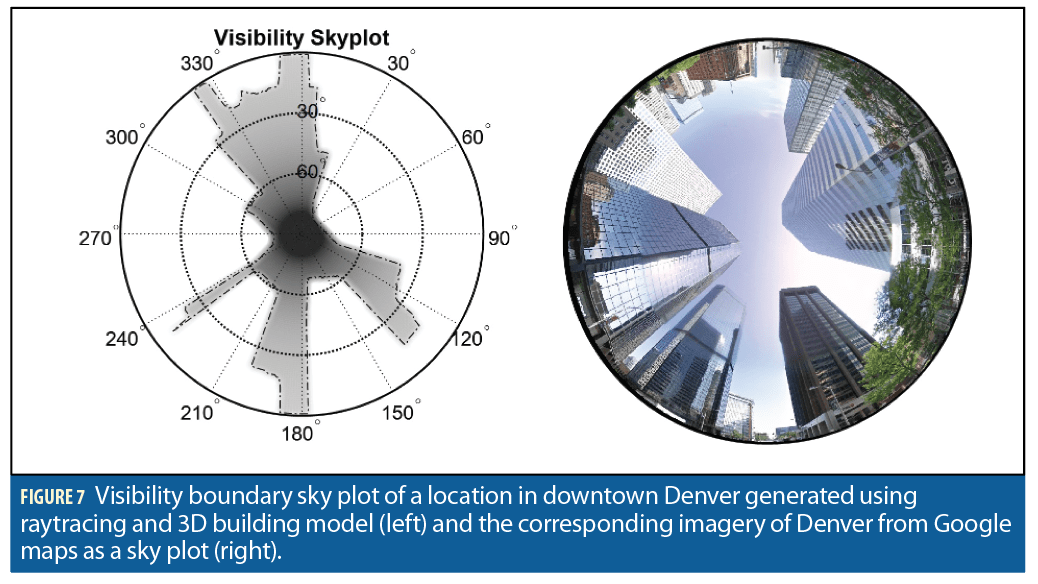
Visibility Prediction. Within our software framework, PBRT is used to trace the signals sent by satellites to a receiver location to determine visibility and detect where signals are obstructed by interceding structures. Using the building model, one can efficiently create a database of visibility sky plots throughout the city of interest. The visibility sky plot is a concept also commonly used in a positioning technique called shadow matching. Visibility sky plots show the direct signal access at candidate locations in the urban environment. A visibility sky plot consists of a single boundary indicating where buildings block the DLOS paths to satellites (Figure 7).
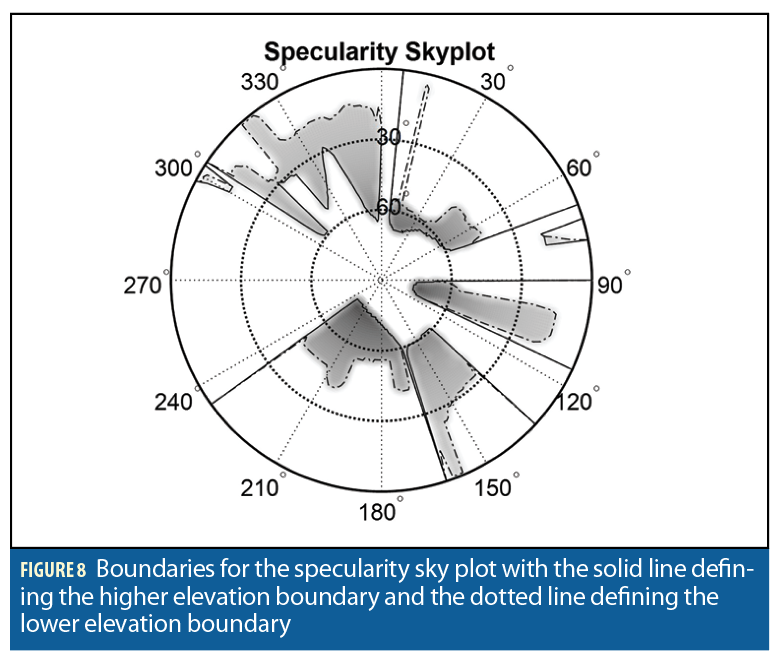
Specular Reflection Prediction. To represent the likelihood of receiving a reflected signal, we construct a similar sky plot based on predicted specular reflections. A reflected signal is predicted when at least 50% of the first Fresnel zon lies on the reflecting surface and is visible to the receiver. This threshold has been shown to be effective in predicting surface reflections for other applications. For a given candidate location, the sky plot predicts whether the DLOS from the location to the satellite is unobstructed or obstructed based on whether the satellite location is above or below the building boundary in the visibility sky plot. Similarly, the specularity sky plot predicts if the candidate location should expect strong reflections, based on whether the satellite DLOS direction is between or outside of the two boundaries in the specularity sky plot (Figure 8).
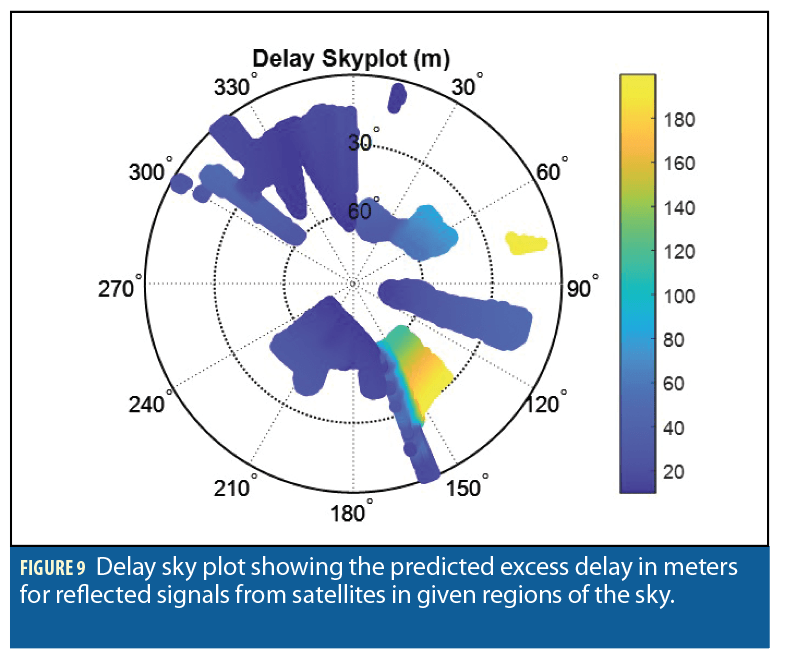
For regions of the sky where the specularity sky plot shows a strong reflection, we also compute the predicted delay of that reflected signal. This is achieved by taking the mean value of predicted delays for the points within the Fresnel zone on the building.
Urban DPE. To enhance the utility of DPE in an urban environment, we investigate three additions to the methods used in weak or sparse signal environments. The first (DPE-BH) restricts candidate locations based on height and building boundaries; the second (DPE-BHV) uses building model based visibility predictions to filter which satellite correlograms are combined in the DPE solution; and the third (DPE-BHVS) uses predicted specular delays to modify the mapping of NLOS satellite correlograms into the DPE solution.
To initialize basic DPE we calculate position solutions at one-second intervals using 10 ms of non-coherent summations at each interval. The method uses a broadcast ephemeris file to calculate the satellite ranges and Doppler frequencies predicted over the search grid of locations and clock-biases centered on the a priori estimates. The combined correlogram is created by summing the signal to noise ratios of the individual satellite correlograms in the position-domain. The correlograms are generated using an FFT based acquisition algorithm from a conventional GPS positioning SDR that has been adapted to the DPE application.
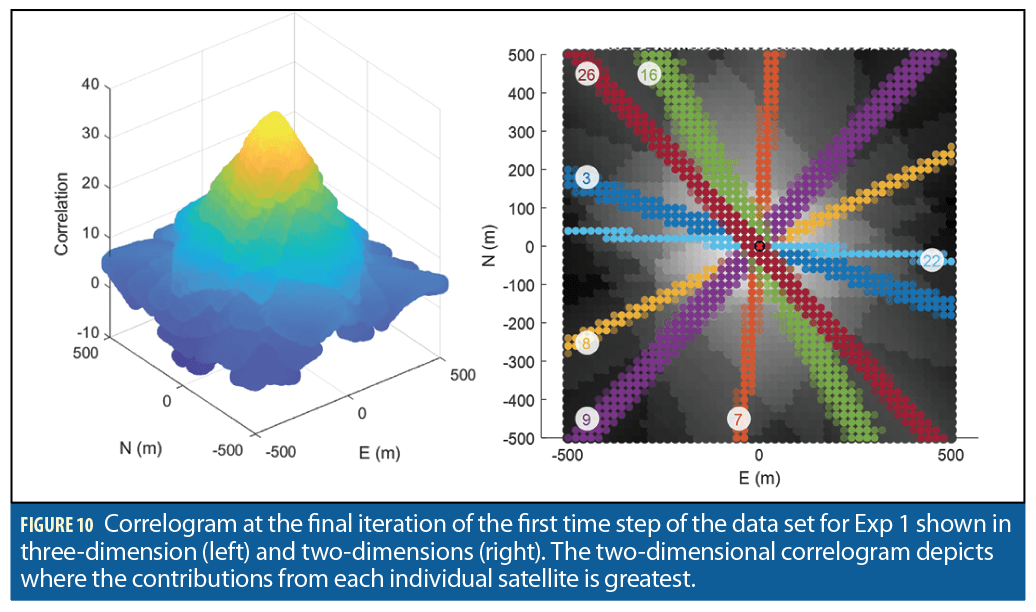
Figure 10 shows the correlogram from the final iteration at the first time step. The 3D correlogram depicts the sum of the individual satellite correlograms in the position domain. The largest correlation value (yellow) represents the position solution. The 2D correlogram also depicts the sum of the individual satellites using a grayscale heat map to represent the largest values (white). Additionally, the 2D correlogram depicts where the contributions from each individual satellite are greatest with these locations represented in a different color for each satellite. At this scale (1 square-kilometer grid) and grid-spacing (20-m), the peak contributions from each satellite appear as lines across the grid and the peaks intersect at a single point.
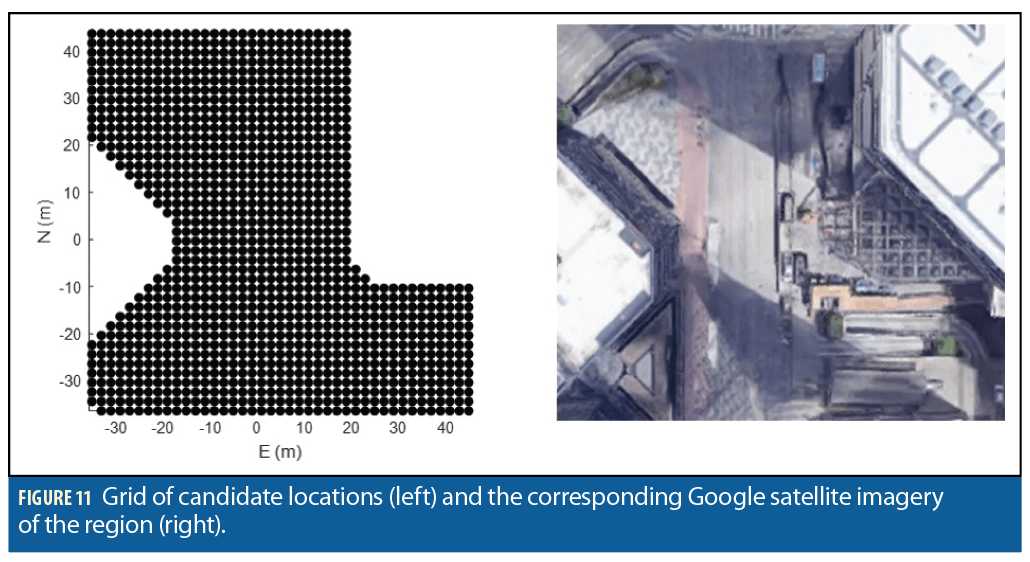
With the clock bias first initialized by a three-step iterative process, the urban environment information is incorporated into the DPE calculations in all subsequent time steps. The candidate locations for the experiments are within the 80 square meter grid shown in Figure 11. Using this grid, the locations that are inside buildings are eliminated from consideration of the position solution. Additionally, since an estimate of the receiver height is provided from the urban building model, the search in the Down component is eliminated. This results in a height-aided solution. We label the basic method of excluding position solutions inside buildings and including height-aiding as the DPE-BH method.
To enhance the solution by incorporating visibility predictions (DPE-BHV method), we add the individual satellite correlogram values only for candidate locations where the satellite is predicted to be visible. In regions where the satellite is predicted to be invisible, the individual satellite correlogram will not be added to the combined correlogram.
As a final step we incorporate range corrections into the DPE based on specular reflection predictions for a method we label DPE-BHVS. We determine whether or not a candidate location is visible and if there is predicted to be a strong specular reflection from the visibility and specularity sky plots. In locations where the sky plots predict a blocked satellite and a strong specular reflection, the correlogram contributes to the collective correlogram. However, the range values mapped from the correlogram to these candidate locations are adjusted based on the delay value obtained from the delay sky plot.
Analysis
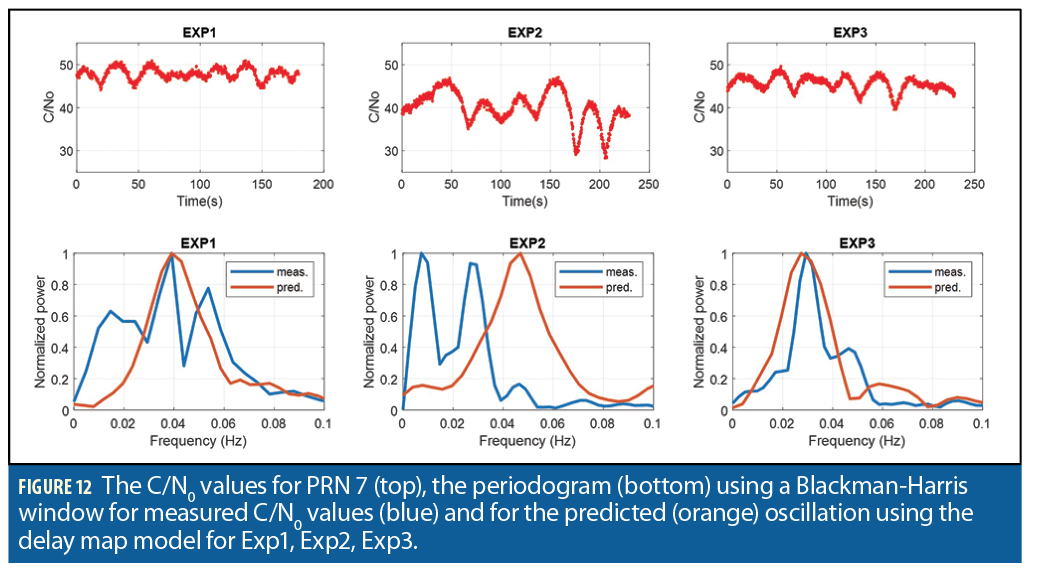
Due to the relative simplicity of the urban surroundings for Exp1, Exp2, and Exp3 compared to Exp4, we use these data sets to illustrate our visibility, specularity, and delay models. A strong specular reflection off the Anthem building from satellite PRN 7 is predicted for the first three experiments. In Exp1 and Exp3, the DLOS signal is not blocked, but Exp2 has a DLOS signal that is predicted to be blocked by a small building. We see in Figure 12 that the C/N0 values for PRN 7 oscillate for Exp1 and Exp3 as is predicted when multipath is present. Exp2 also has an oscillatory pattern indicating that multipath is also present in this experiment, which is not what our model predicts. However, the C/N0 values are lower than those for Exp2 and Exp3, which may be an indication that though the DLOS signal is predicted to be blocked, there is diffraction around the corner or transmission through the building. Using the delay map we estimate the predicted frequency of the oscillation and compare that to the frequency of oscillation found in the C/N0 data. In Exp1 and Exp3 the peak frequencies for the measured and predicted oscillations agree, but the oscillation frequency for Exp2 is not well predicted using the delay sky plot model. From this analysis, we determine that the model is too simplistic to account for the PRN 7 signal present in Exp2.
Results
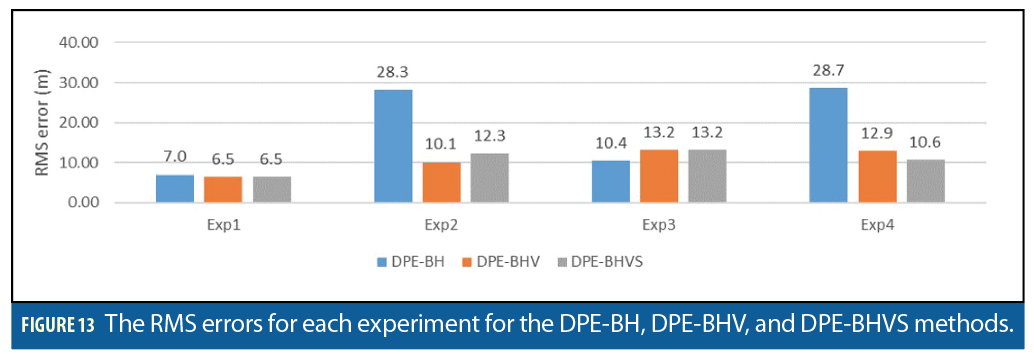
Applying the proposed DPE methods to all data sets, the position results shown in Figure 13 are obtained. Here we see that for all three methods Exp1 has the smallest errors. Since the results using the DPE-BH method alone are already the smallest of all four data sets, additional information in the later methods do not have much of an effect on the solution. There is only a 0.5 m improvement in RMS error when additional information about the visibility is included into the model. This is a predictable result as there is good visibility in this location. Visibility information also does not improve the RMS error in Exp3. This is likely due to the good visibility conditions in this region.
The position solution for Exp2 is improved by including visibility information. Recall that this experiment has less visibility than Exp1 and Exp3 due to the small building directly to the west. There is no further improvement by adding in specularity information. This may be due to the model’s inability to account for the signal characteristics from PRN 7 as discussed. PRN 7 is predicted to have a blocked DLOS signal, but our model does not currently account for signal diffraction which is likely present in the Exp2 PRN 7 signal.
Since Exp4 has the worst visibility conditions of all the experiments, using the visibility information in the DPE-BHV improves the RMS error. In this data set, the RMS error improves when specularity predictions are included. This is likely due to the presence of many large reflectors in the environment.
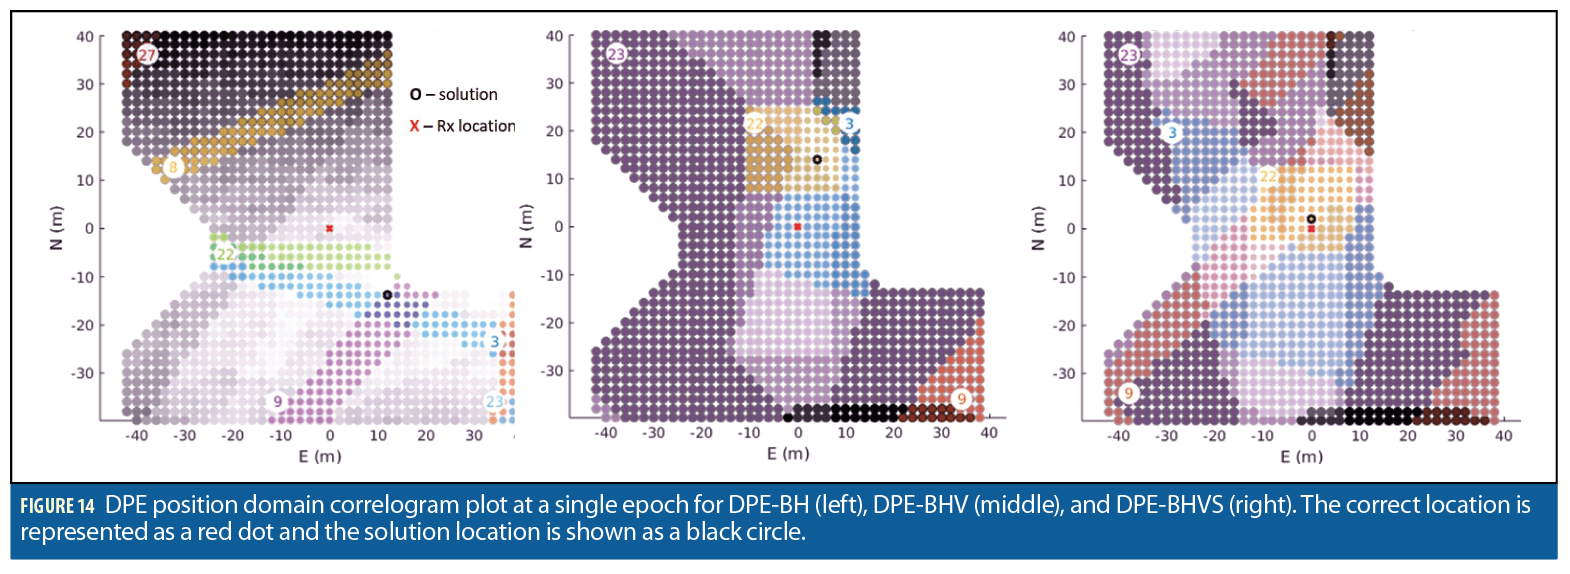
Figure 14 illustrates the results from a single epoch of Exp4 using the three different methods where the solution is improved by adding visibility and specularity information. The first panel displays results from using the DPE-BH method. Unlike the correlogram depicted in Figure 10, at this scale the peak contributions from individual satellites do not overlap at a single point. The correct location of the receiver (red dot) does not coincide with any of the peak satellite contributions. The position solution chosen (black circle) is located where two satellite peaks overlap (PRNs 3 and 9). The second and third panels show results from the DPE-BHV and DPE-BHVS methods. Including visibility and specularity predictions alters the appearance of the correlogram into a patchwork of contributions from different satellites. Using DPE-BHV, the chosen position solution is a location where three satellite peak contributions overlap (PRNs 3, 22 and 23). In the DPE-BHVS method illustrated in the final panel, a fourth satellite peak contribution (PRN 9) overlaps with the correct receiver location. This satellite was added to the correlogram using information from the delay sky plot.
Conclusion
A new DPE method that incorporates visibility and specularity information using specular matching improves position solutions in several highly blocked and reflective environments. The predictions allow NLOS and absent signals to contribute to the position solution. Tests on several data sets showed them to be effective only in environments where there is very limited visibility. The improvement in these cases reduced the RMS horizontal position errors from 30m to 10m. We plan to investigate these and other data sets to better understand the conditions under which urban model-based predictions can enhance GPS positioning performance.
Acknowledgments
This research was funded through a fellowship through The Charles Stark Draper Laboratory, Inc. This article is based on a paper presented at the ION International Technical Meeting 2020: “Improved Urban Navigation with Direct Positioning and Specular Matching.”
Manufacturers
The data was collected on an NT Lab NT1065 GNSS data collection system with a Tallysman Wireless antenna.