
This research analyzes the wide-area 2022 Texas GPS jamming incident using data from airborne receivers through Automatic Dependent Surveillance – Broadcast (ADS-B) and ground receivers at Continuous Operating Reference Stations (CORS).
MATHIEU JOERGER, CHENMING FAN, SANDEEP JADA, VIRGINIA TECH
Wide-area GNSS jamming does not only occur in foreign countries during military conflicts (Syria and Ukraine), but it also has been happening in the contiguous United States, causing major operational and financial impacts on civilian applications.
In this article, we use data from airborne receivers through Automatic Dependent Surveillance—Broadcast (ADS-B) and from ground receivers at Continuous Operating Reference Stations (CORS) to analyze a wide-area GPS jamming incident that occurred in Texas on October 17 to 18, 2022. While the source of a 33-hour long January 2022 Denver airport incident was found [1], the two-time 12-hour long October 2022 Texas jamming remains a mystery.
This is an ongoing investigation; we present information that complements our December 2022 report to the United Nations [2] and Stanford’s May 2023 Inside GNSS article [3].
The Texas Jamming Event
On October 17, 2022, the Federal Aviation Administration (FAA)’s Air Traffic Control System Command Center (ATCSCC) issued an advisory for the Dallas region about GPS anomalies “dramatically impacting GPS (RNAV [area navigation]) arrival and GPS SID [Standard Instrument Departure] routes for all airports in D10 airspace [Dallas-Fort Worth Terminal Radar Approach Control (TRACON) area].” The advisory went on to say: “This was unplanned and the cause is yet unknown” and runway “RY 35R is unusable at this time due to the GPS anomalies” [4].
This unexplained GNSS jamming event had no direct safety consequences because alternative means of navigation, including under visual flight rules, were available. However, it caused operational disturbances that came with the cost of closing down a runway. Ten months later, we still do not know the source of this incident.
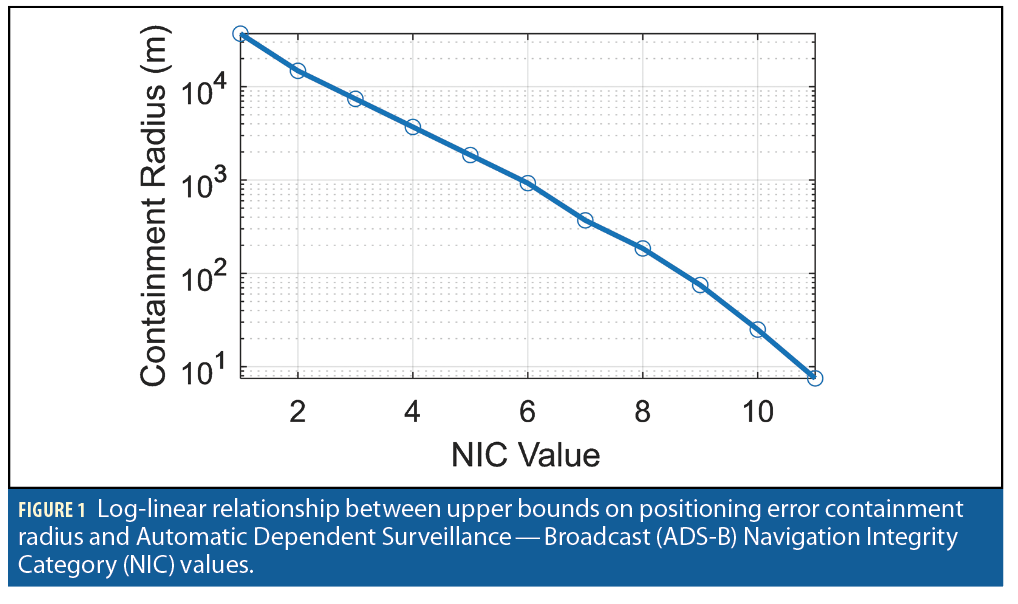
The government, industry and academia have been investigating this and other jamming events, including under the Department of Defense (DoD)’s Defense Innovation Unit (DIU) Harmonious Rook effort [5]. An effective means to evaluate the spatial and temporal scope of wide-area jamming is using readily deployed ADS-B transmitters. ADS-B has been mandated on all U.S. aircraft since 2020. ADS-B is an air traffic management tool that requires all aircraft to communicate their position estimates, which are primarily based on GPS. These estimates have GPS quality indicators including the Navigation Integrity Category (NIC). Figure 1 illustrates the log-linear relationship between NIC and containment radius, which is a probabilistic bound on horizontal positioning errors; the smaller the NIC value, the larger the containment radius.
Publicly available sources of ADS-B data include crowdsourced ADS-B databases such as ADS-B-Exchange, The OpenSky Network, FlightAware and Flightradar24. An ADS-B-In receiver enables the collection of ADS-B data broadcast by all aircraft visible within a connectivity radius, provided the communication channel is not obstructed by terrain or otherwise interfered with. Any participant with an ADS-B-In receiver (sometimes a dedicated receiver) can contribute to the public databases by sharing their recordings online with a central facility that then publishes ADS-B data with varying degrees of screening and pruning.
Since 2018, several research groups have used ADS-B to raise attention on wide-area jamming in the Middle East, Eastern Europe and the U.S. Two groups in particular have published frequently. First, John Wiseman who started the GPSjam.org website tweeted about the 2022 Texas incident as early as October 17 [6]. Second, Zixi Liu and the Stanford GPS Lab developed a series of ADS-B-based tools to not only detect jamming, but also exclude false positives and localize jammers. In both cases, low NIC values are used as a primary indicator of jamming, which requires significant data pre-processing.
The challenges of crowdsourced ADS-B-based jamming analysis include:
1. Jamming causes low ADS-B NIC values, but it is only one among many causes for low NIC. For example, aircraft banking during flight training maneuvers causes poor GPS performance and hence low NIC. High-dynamic aircraft maneuvers occur frequently near training fields [7].
2. Another limitation of using NIC to measure interference is it is not a direct measure of radio-frequency interference (RFI). Attempts were made at relating NIC to suspected jamming power [7]. However, NIC is unavailable (or null) when the GPS receiver is jammed.
3. GPS receivers connected through ADS-B are numerous, and unlike ground-based receivers, airborne receivers can have open, unobstructed line-of-sight (LOS) to ground jammers. However, even during times of high air traffic density, airspace sampling is sparse, especially near the ground. A static jammer can only be roughly localized using ADS-B unless it is near an airport or under a busy aircraft route.
4. The coverage of ADS-B-In ground receivers feeding the online database is database-dependent, poor in sparsely populated regions, and reduced in mountainous regions where terrain obstructs LOS to the airborne ADS-B transmitters.
5. Crowdsourced databases report inconsistent, incomplete, repeated, erroneous, and delayed information that must be sorted out before being exploited.
The sheer size and long duration of the October 2022 Texas interference mitigate most of these challenges. The next sections will show that many aircraft were quasi-simultaneously impacted by lower-than-nominal NIC values over an identifiable region in a way that leaves no doubt to the presence of a jammer. Still, the jamming source is unknown.
In this article, we introduce our own processing and representations of low ADS-B NIC occurrences and check our results using multiple databases. Rather than trying to localize the jammer, we focus on analyzing changes in jamming over time. We also analyze individual flights, which show erroneous trajectories that could be interpreted as spoofing. Finally, by processing a month of data from 162 Texas CORS receivers, we ascertain the jamming had no widespread impact on ground receivers.
ADS-B Data Processing
This section describes the methods we developed and implemented to process 135,500,543 ADS-B messages recorded in the OpenSky Network database from October 16 to 19, 2022, over a 10-degree-latitude-by-10-degree-longitude area covering most of Texas, Oklahoma, Louisiana and Arkansas.
Recent technical work on ADS-B data processing for jamming detection and localization mainly includes research by the Stanford GPS Lab. Following the Code of Federal Regulations [8] and in the Advisory Circular on ADS-B operations [9], a key recommendation is to declare jamming detection when NIC values are lower than 7. In [3], The OpenSky Network data is used to analyze the January 2022 Denver event where ADS-B message reception was limited by poor receiver coverage and physical obstructions due to the mountain range west of Denver. Reference [3] also explores duplicate ADS-B message management, receiver time-stamping inconsistencies, and flight path interpolation and reconstruction to support jammer localization. Unique to jamming is the fact NIC values drop suddenly prior to the signal being lost, but this drop is often gradual enough to help distinguish jamming from other causes of signal loss. Reference [7] identifies the impacts of highly dynamic aircraft maneuvers on jamming-unrelated NIC variations.
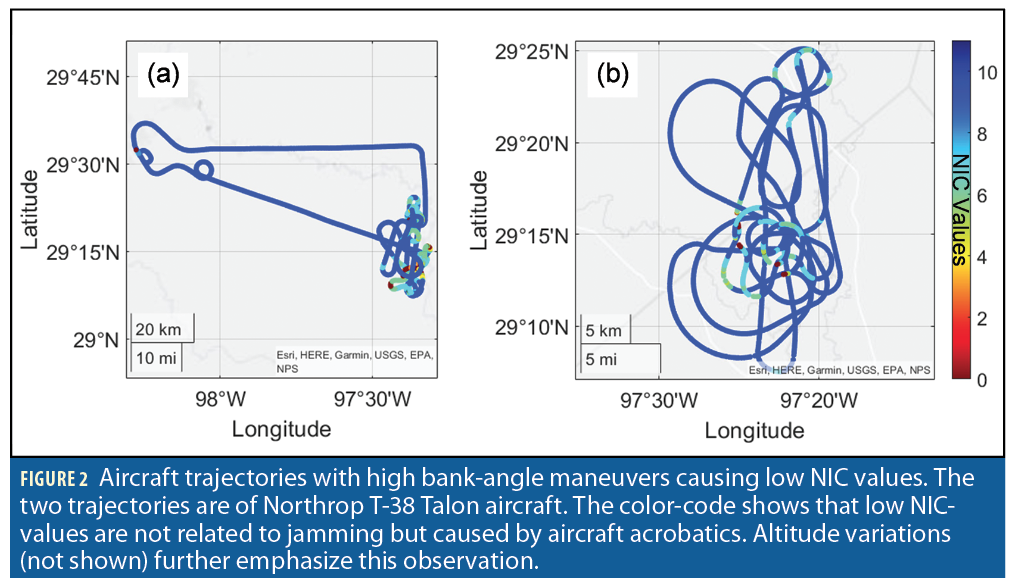
Building upon [7], our research uses a NIC threshold of 7: We will emphasize occurrences at the transition NIC=7. In addition, we address low NIC values caused by highly dynamic aircraft maneuvers illustrated in Figure 2. Aircraft acrobatics are numerous in the Texas dataset because of the multiple flight training fields in the Dallas, San Antonio and Oklahoma City regions [10]. We also observed sweeping patterns by crop-dusters and geo-surveying aircraft.
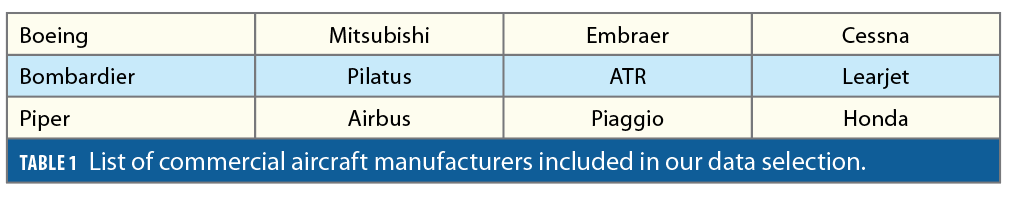
However, in this research, unlike in [7], we exclude data by simply selecting aircraft based on their International Civil Aviation Organization (ICAO) identification numbers (IDs). Each ADS-B message contains a 24-bit data field encoding the aircraft’s unique ICAO ID. The OpenSky Network provides a table of ICAO IDs with their associated aircraft manufacturers, models or owners, etc. [11]. We only process data from those ICAO IDs corresponding to the aircraft manufacturers listed in Table 1. This excludes military and fast maneuvering aircraft that are built, for example, by Lockheed Martin, Northrop Grumman and Raytheon, for which low NIC values are regularly observed over specific areas even when no jamming is occurring.
In this regard, a complicating factor in the interpretation of NIC is different aircraft make and models and ADS-B versions exhibit varying levels of resilience to jamming. Position, navigation and timing (PNT) resilience depends on the aircraft GNSS equipment, on whether position estimation is augmented using inertial navigation systems (INS), and on whether the operational settings include RFI checks or fault detection and exclusion, using receiver autonomous integrity monitoring, or RAIM.
In addition, we excluded data showing constant low NIC values throughout an aircraft’s trajectory, which may be caused by aircraft receiver-specific issues [7]. Then, throughout our dataset, low NIC values are a nominal occurrence during take-off and landing at airports in Dallas (DFW), Oklahoma City (OKC), San Antonio (SAT), Austin (AUS) and Houston (IAH). (We have consistently observed this feature throughout U.S. airports.) We therefore excluded these occurrences unrelated to jamming. Overall, we excluded approximately one fourth of the 135 million ADS-B data samples because they obscured the jamming analysis. We excluded:
• 32,644,332 data points (24.09%) based on aircraft manufacturers,
• 480,155 data points (0.35%) based on low barometric altitude, and
• 59,583 data points (0.04%) for flights with constant low NIC values.
Figure 3 shows ADS-B data recorded on October 16 to 19, 2022, over Texas, Oklahoma, Louisiana and Arkansas. The vertical axis is the horizontal distance to DFW and the horizontal axis is local time. Barometric altitude is color-coded for NIC lower than 7, and the marker size scales with NIC value: the smaller the NIC, the larger the marker size (and the larger the containment radius). Orange markers in the background designate data points at the threshold NIC=7 and represent nominal performance. Higher NIC values make up the overwhelming majority of data but are left out to ease visualization. Data points that are excluded are greyed out. Dashed grey horizontal lines show the distances of OKC, AUS, IAH and SAT to DFW. Data points that indicate detection are highlighted with a red marker-edge color.
Figure 3 provides an overview of the entire dataset. Orange markers show nominal variations in aircraft traffic density from local daytime to nighttime. Grey markers show increased activity near OKC and SAT training fields during weekdays as compared to Sunday, October 16, 2022. Red markers show a dramatic increase in low NIC values at all altitudes over DFW abruptly starting at 12:00 (local noon) on October 17, and abruptly ending at 18:00 on October 18. Low traffic density on October 18 from 0:00 (local midnight) to 6:00 prevents us from observing whether jamming was discontinued during this period. This concentration of low NIC values is strong evidence of jamming at DFW and extending at distances up to 300 km from DFW. Vertical red lines are individual aircraft tracks impacted by low NIC values, which may require further analysis in future research.

Overview of Spatial and Temporal Impacts
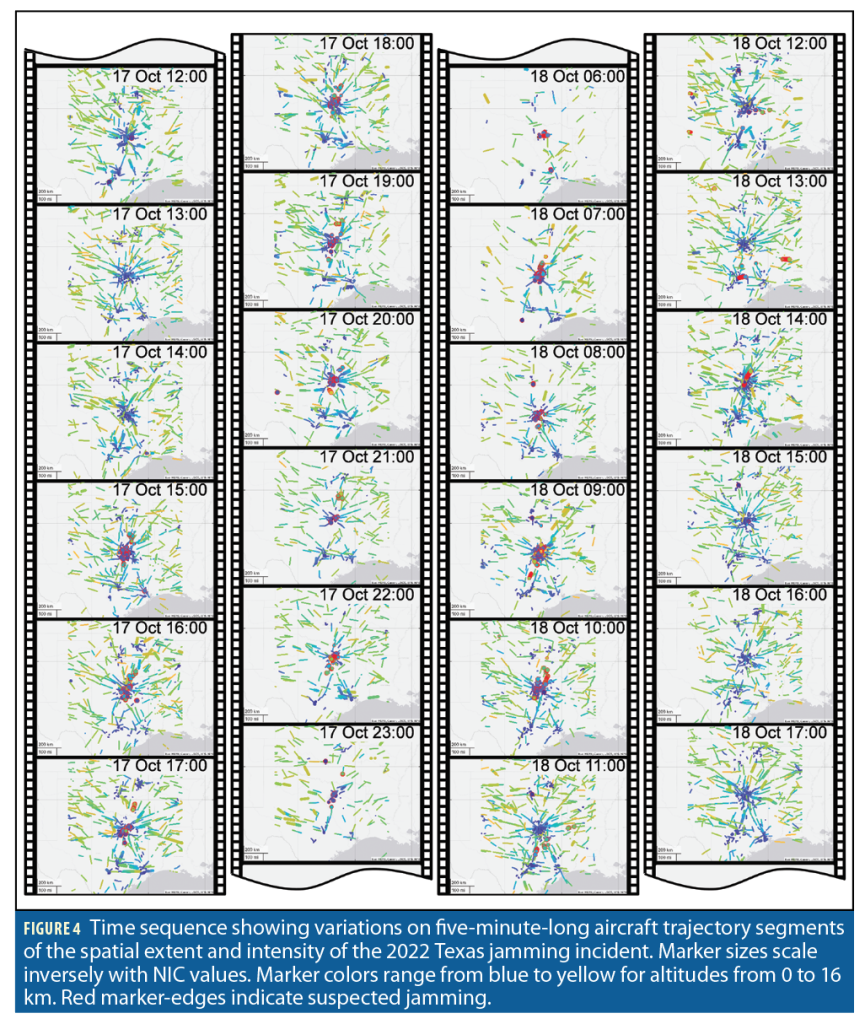
Figure 4 is a movie strip showing 24 maps of five-minute-long aircraft trajectory segments. Snapshots are taken at regular one-hour intervals on October 17 from noon to midnight, and on October 18 from 6:00 to 18:00 to highlight the most striking jamming occurrences. We use a marker code similar to Figure 3, but we include NIC larger than 7: marker size scales with containment radius, marker color ranges from blue to yellow designating barometric altitudes from 0 to 16 km, red marker edges designate suspected jamming. Air traffic density quickly decreases at the end of the day on October 17 and picks up gradually on October 18. While jamming seems to concentrate near DFW on the afternoon of October 17, it sometimes spreads over a wider area on October 18.
Figure 5 zooms in on the DFW Metroplex, i.e., the Dallas-Fort Worth-Arlington metropolitan area, and represents all suspected jamming occurrences during two days on a same three-dimensional plot. This representation could help localize the jamming source. However, it is challenging to decorrelate the intensity of jamming from the data sampling density: jamming cannot be observed where data is unavailable. Liu’s work and other government efforts have aimed at developing refined approaches to address this challenge [3,7].

Intermittent, Direction-Changing Jamming?
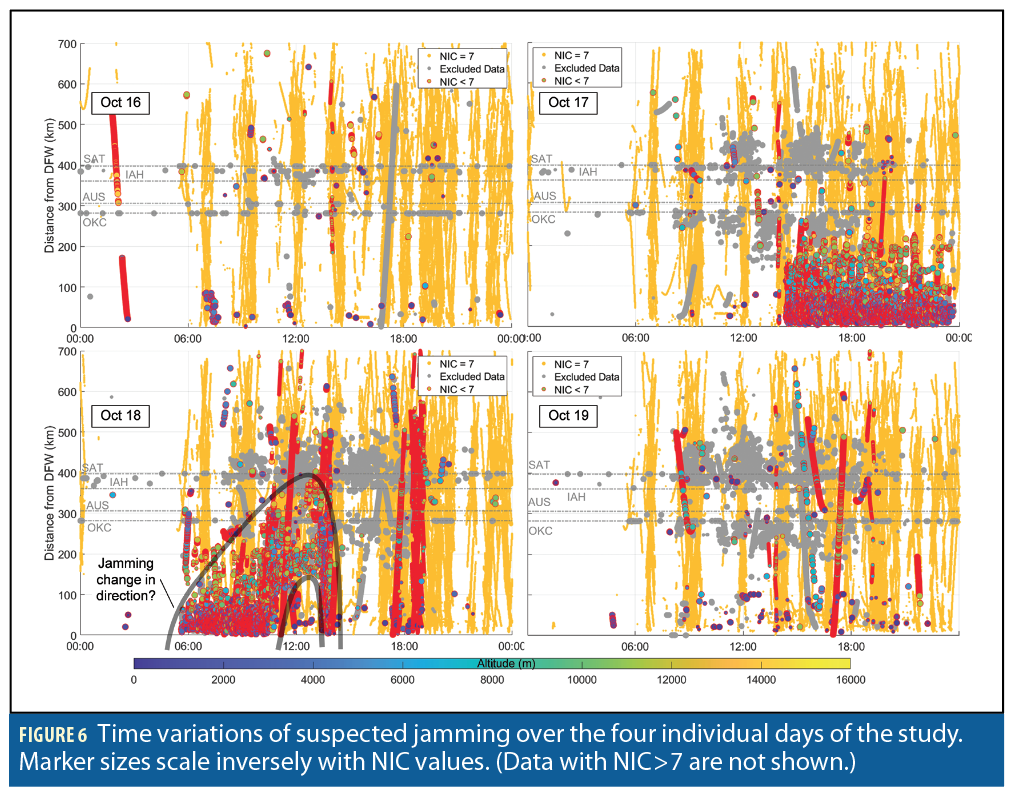
The four panels in Figure 6 give a detailed representation of the data in Figure 3. We zoom in on the four individual days of the study. The comments that were made on Figure 3 are still valid. Features worth pointing out include intermittent nominal NIC=7 samples (vertical orange stripes in the background), which repeat themselves either because of daily aircraft schedule or because of periods of relatively poor but nominal GPS satellite geometry. Red markers suggest substantial jamming over a 200 km radius centered at DFW and impacting all altitudes. The cloud of red circles seems to decrease in intensity at the end of October 17, but this may be due to traffic density reduction.
On October 18, jamming starts at 6:00 and lasts till 15:00. An intriguing change in jamming pattern (highlighted with grey lines) occurs starting at 11:00 when the interference seems to move away from DFW and then back closer to DFW at 14:00. It also seems to only impact higher altitude aircraft during these four hours. At 14:00, jamming is back over DFW and simultaneously impacts low altitude aircraft near AUS. The interference then disappears. A few more aircraft departing from DFW are impacted from 17:00 to 19:00 and stay impacted during a large part of their flight.
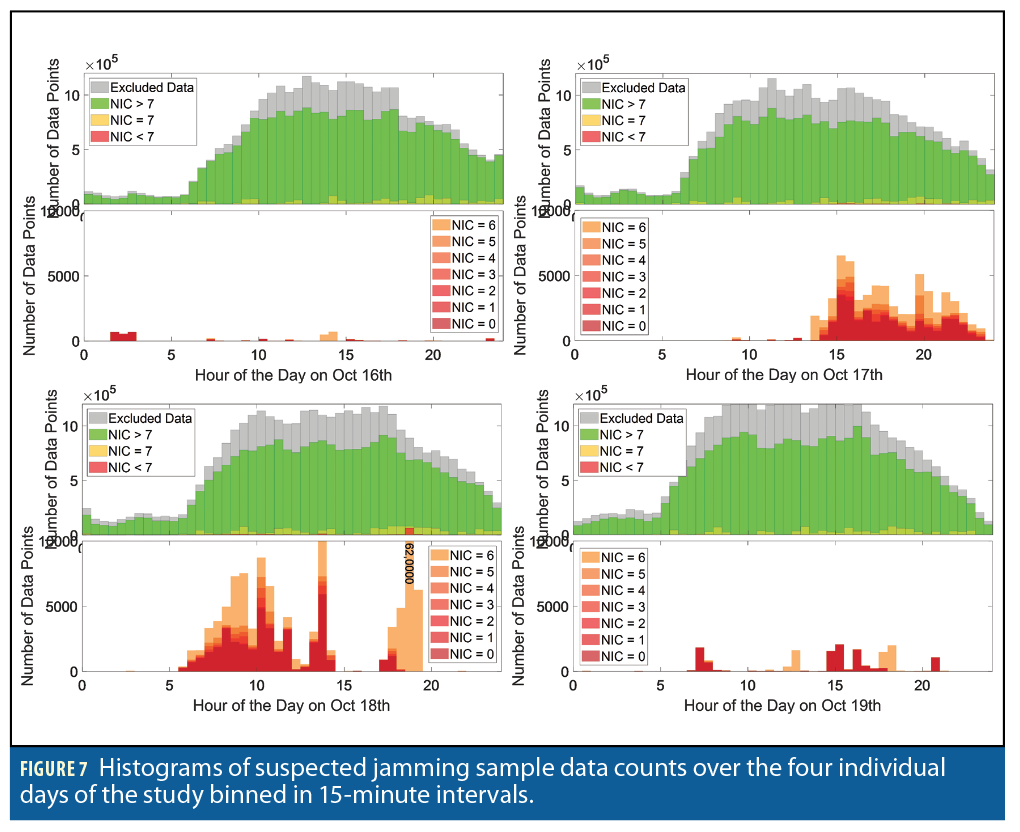
Figure 7 aims at quantifying these trends using histograms. Bin sizes of 30 minutes capture temporal trends in jamming activity. Two histograms are shown for each day of the study. Top histograms report the total count of sample data over each 30-minute
interval, distinguishing data points that were excluded from others that are then color-coded with NIC values. The lower histograms focus on NIC values lower than 7 color-coded in shades of red. NIC<7 occurrences are comparatively so rare they barely appear at all on the top histograms.
Figure 7 again highlights the night-to-daytime change in traffic density and quantifies the number of excluded data samples over the total number of samples. NIC values lower than 7 occur more frequently than usual on the afternoon of the 17th and on the 18th. We can observe changes in jammed samples that seem to roughly correlate with total sample availability. 62,000 samples with NIC=6 were observed on October 18 at 18:00 to 18:30.
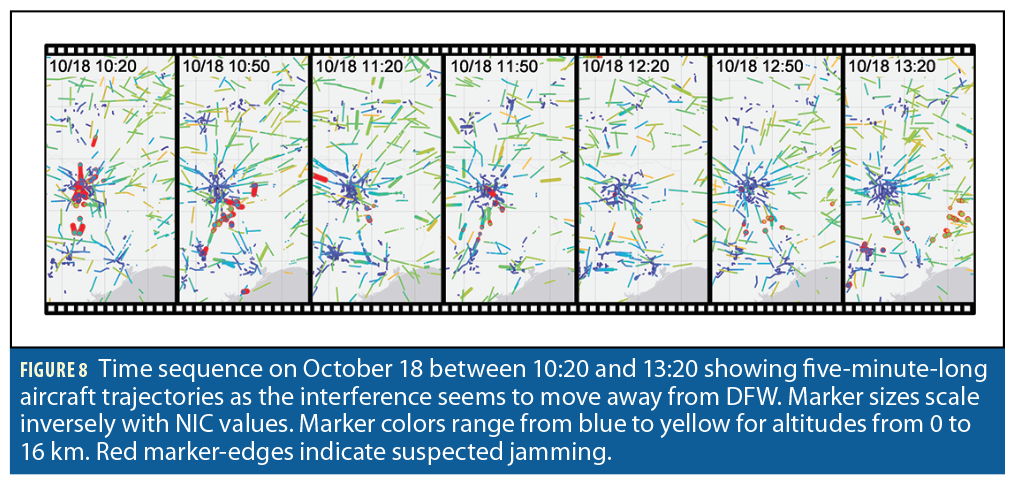
To better understand the change in jamming intensity that seems to occur on October 18 between 11:00 and 14:00, we localize the suspected jamming events on a map of Texas in Figure 8. Shortly after 10:30, the interference seems to move away from DFW toward the South and East. By 13:20, jamming impacts low altitude aircraft near AUS and higher altitude aircraft in the East. By 14:00 jamming is back over DFW as shown in Figure 4.
Erroneous Tracks on Individual Aircraft Trajectories
This part of the research was initially motivated by finding aberrant aircraft position estimates as potential early indicators of partial jamming of GNSS receivers. We ended up finding worrisome erroneous tracks that may be interpreted as spoofed trajectories.
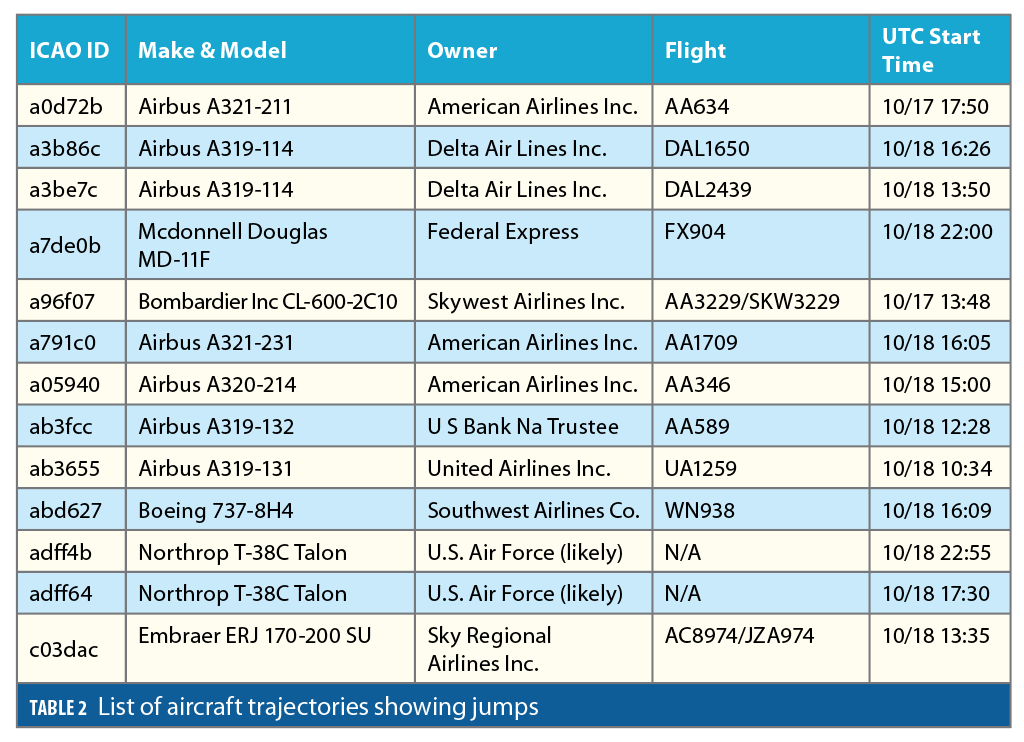
We use a coarse, straightforward test to detect ADS-B-reported “jumps” in aircraft positions between two consecutive time steps tk and tk+1 . If the three-dimensional aircraft displacement between tk and tk+1 exceeds a predefined threshold T, then the trajectory is flagged and visually inspected. ADS-B messages are not recorded at regular time-intervals. Thus, the jump threshold is defined as:

where vair is an upper bound on aircraft ground speed, taken to be 340 m/s, and djump is a coarse, unrealistically large displacement between locations that is guaranteed to indicate an anomaly even in the presence of nominal PNT errors. Picking djump=161 km (100 miles) as a first cut was enough to find relevant trajectories. Thirteen aircraft trajectories were found that are listed in Table 2. They are identified by ICAO ID and approximate trajectory start-time in UTC (universal time coordinated). For most of these 13 trajectories, the NIC value dropped right before the jump, followed by erratic positioning and/or loss of signal, followed by realistic positioning recovery with NIC values quickly increasing to higher than 7.
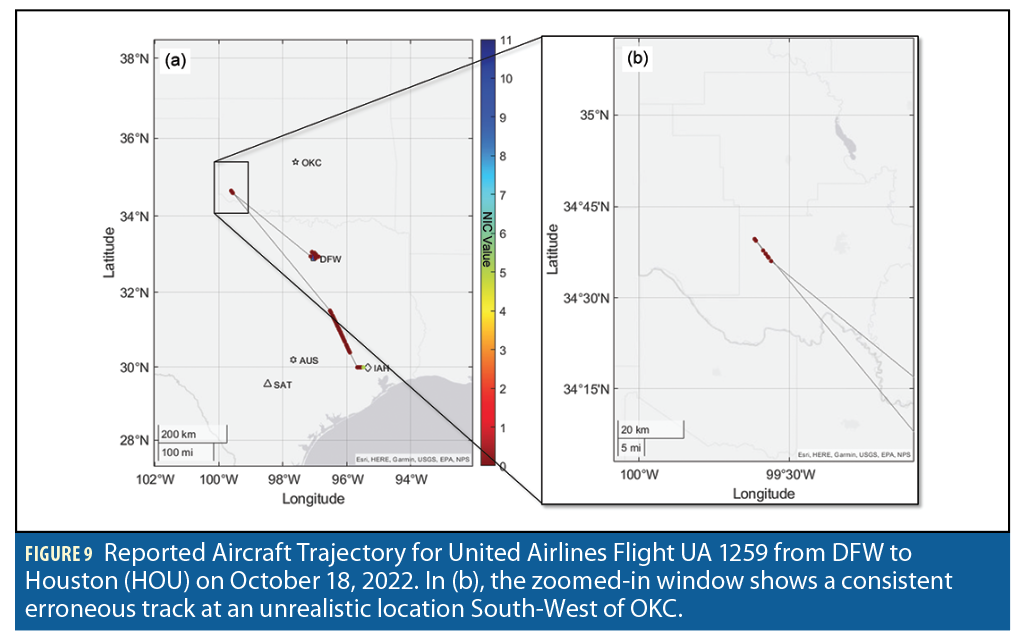
Figure 9 shows the ADS-B-reported aircraft trajectory for flight UA 1259 from DFW to Houston (HOU) on October 18, 2022. Upon departure from DFW, the NIC value drops and remains low during most of the flight. The estimated position then jumps to an unrealistically distant location South-West of OKC.
Figure 9(b) shows that, after the jump, ADS-B reports a fairly-consistent, roughly-linear trajectory over a few time epochs. The reported aircraft location then jumps back to a realistic trajectory segment between DFW and HOU. A loss of signal occurs again before the trajectory reaches HOU. NIC values increase again prior to reaching HOU. The multiple losses of PNT solutions appear as if jamming was occurring at multiple locations, but it may be caused by varying jamming intensity. It is reassuring that NIC values were consistently low throughout this flight, but this was not the case with all flights in Table 2.
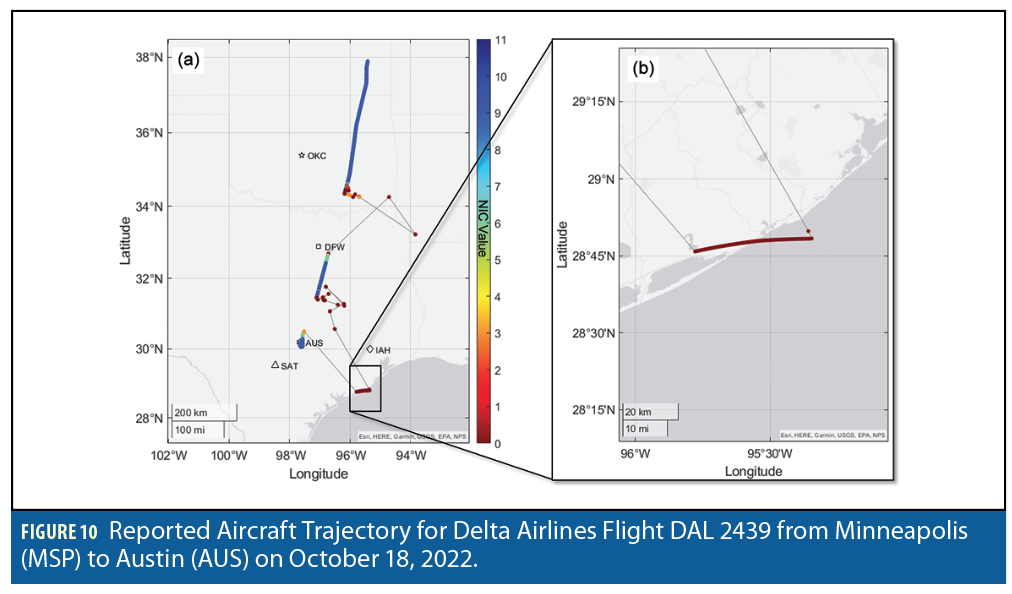
Figure 10 is another example of a trajectory jump leading to erroneous tracks. It shows the ADS-B-reported aircraft trajectory for flight DAL 2439 from Minneapolis (MSP) to AUS on October 18, 2022. In Figure 10(a), the aircraft flew southward with high NIC values and no noticeable positioning issue until it approached DFW. There, the NIC value suddenly dropped, the estimated position scattered over tens of miles, and GNSS solutions appeared to be lost. We checked this event using two other ADS-B databases. There is a possibility this first apparent loss of solution could have led to an erroneous track, for example, in the middle of the Gulf of Mexico where The OpenSky Network does not report any data.
In Figure10(a), flight DAL 2439’s reported trajectory came back on track after passing DFW with higher-than-7 NIC-values until it scattered again mid-way between DFW and AUS. It jumped to an obviously erroneous but consistent, quasi-linear track along the coast of the Gulf of Mexico. The zoomed-in panel in Figure 10(b) gives a better view of this track. The erroneous track occurred around 10:50 a.m. and can also be seen on the second panel in Figure 8. While we are only displaying data from the OpenSky Network, we cross-checked again using two other databases. We also checked there were no other aircraft trajectory along the Gulf coast that could match this erroneous track. It is not an ADS-B reporting mistake.
Figure 11 shows the reported DAL 2439 barometric altitude profile from the time it entered Oklahoma to landing in AUS. We recommend comparing this curve to the GNSS-derived geometric altitude profile, which was unavailable at the time of writing. Barometric-to-geometric altitude discrepancies can serve as an early indicator of jamming and can provide useful information on the jammer’s intentions.
CORS Data Analysis: No Impact on Ground Receivers?
We processed carrier to noise (C/N0) data at one-second intervals over the entire month of October 2022 at 162 CORS receivers in Texas and Oklahoma to show there was no noticeable disturbance due to ground receiver jamming.
The two C/N0-based jamming monitors implemented in this research are described in [12]. This study focuses on GPS L1 only. We use an automated three-step procedure.
1. A time-differenced C/N0 monitor identifies jam-free data and excludes potential anomalies over several days before October 16.
2. Jam-free data is then used to establish a nominal mean and bounding-variance model of C/N0 measurements. For each location, for each satellite, a three-parameter elevation-dependent mean
C/N0 model is derived. The resulting residuals (measured-C/N0-minus-mean-model) exhibit a random behavior that we model using a three-parameter elevation-dependent Gaussian overbounding function. This is instrumental in automatically setting location-dependent and time-epoch-dependent thresholds that limit the risk of false alerts to a reasonably low value, low enough to allow for further manual inspection if needed.
3. We then implement a model-based C/N0 detector that checks for deviations between the pre-established jam-free model and the C/N0 data. The test was designed to be Neyman-Pearson optimal in the sense that it minimizes the risk of not detecting small off-nominal deviations that are consistent across satellites, assuming jamming simultaneously impacts multiple satellites [12].
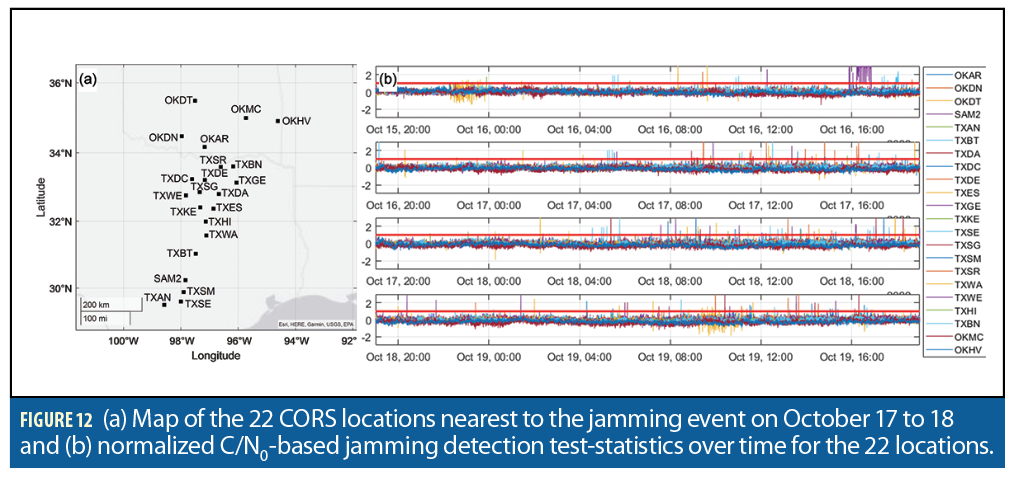
We start by applying this method to the 22 CORS locations closest to the high-intensity jamming occurrences observed in the ADS-B data. The 22 CORS site map is shown in Figure 12(a). Figure 12(b) shows the detection test statistics described in step (3), which we normalized by the corresponding detection thresholds. When the resulting normalize quantity exceeds a value of one, detection is declared. The four subplots in Figure 12(b) show the normalized test statistics on October 16 to 19, respectively. The 22 color-coded curves correspond to 22 locations. The curves mostly stay below the normalized detection threshold value of one, with no noticeable excursions on October 17 to 18. We did not observe significant jamming on the ground.
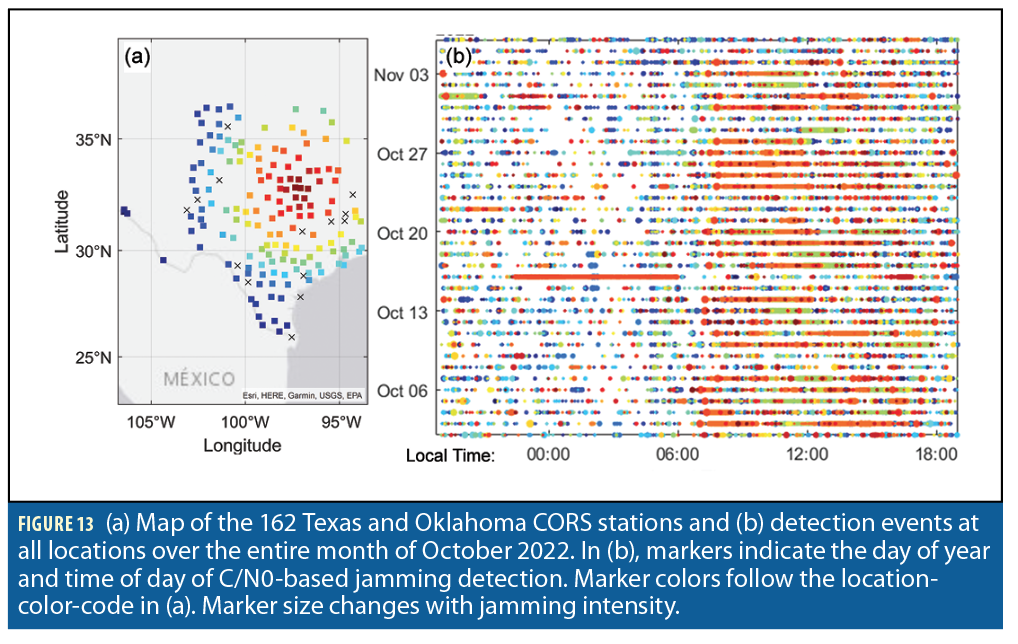
We then extended this analysis to the 162 CORS sites mapped in Figure 13(a). The CORS locations are color-coded with respect to their distance to DFW. Fourteen stations had location-specific issues and were simply discarded. We computed the normalized test statistics for the remaining 148 stations at regular 1-second intervals during October 2022 and plotted them on a day-of-year (DOY) versus time-of-day (TOD) chart in Figure 13(b). Markers are colored according to CORS receiver location in Figure 13(a), and marker size changes with normalized test statistic value to represent jamming intensity. We do not represent cases when the test statistic was lower than the threshold. Thus, one can observe more detected events during day-time versus night-time, and during weekdays versus weekends. October 16 is easy to find because an interference was picked up at 00:00 to 06:00 at CORS station TXTH in the outskirts of Dallas (continuous line of orange markers). TXTH was not included in Figure 12. This event looks unrelated to the jamming event of interest. October 17 and 18 do not exhibit any particular interference activity on the ground.

Conclusion
The October 2022 Texas jamming incident remains a mystery. Publicly available ADS-B data demonstrates the presence of widespread radio frequency interference but is insufficient to identify its source. The disturbance mostly impacted the airspace above Dallas Fort Worth. Our analysis suggests that jamming might have been intermittent, and may have changed direction on October 18. We found evidence of multiple erroneous tracks, which may be interpreted as spoofed trajectories. An upward looking directional antenna might have been employed because the jamming signal did not affect ground receivers. Regardless of its intentions, the jammer has effectively eluded identification for more than 10 months.
Acknowledgements
The authors would like to thank Steve Langel and Keith McDonald for supporting the development of tools used in this research. We also thank the FAA’s Ken Alexander, James Aviles and Sean Memmen and Stanford University’s Todd Walter for motivating and discussing this research. The authors would like to thank VT alumnus Casey Hall who started this effort in 2022. The authors are also grateful to The OpenSky Network and to the CORS network for providing data for this study. The opinions expressed in this article are the authors’ own and do not necessarily represent the views of the individuals cited above.
References
(1) The Cybersecurity and Infrastructure Security Agency (CISA), “GLOBAL POSITIONING SYSTEM (GPS) INTERFERENCE,” CISA Insight Newsletter, December 2022.
(2) M. Joerger, “Sharing and Crowdsourcing GNSS Data to Monitor and Protect the GNSS RF Environment,” United Nations International Committee on GNSS’ 10th Workshop, Vienna, Austria, December 2022.
(3) Z. Liu, S. Lo, T. Walter, and J. Blanch, “GNSS Interference: Getting to the Source,” InsideGNSS, May 2023:
(4) Federal Aviation Administration (FAA)’s Air Traffic Control System Command Center (ATCSS), “ATCSCC ADVZY 069 D10/ZFW 10/17/2022 D10 GPS ANOMALIES,” ATCSS Advisory, 2022.
(5) Anonymous, “DoD in Search of GNSS Spoofing Counters under Harmonious Rook Rubric,” InsideGNSS, 2021.
(6) J. Wiseman, “NOTAM for Dallas Fort Worth Airport: ATTN ALL AIRCRAFT GPS REPORTED UNRELIABLE WITHIN 40NM OF DFW,” Twitter, 2022.
(7) Z. Liu, J. Blanch, S. Lo, and T. Walter, “Investigation of GPS Interference Events with Refinement on the Localization Algorithm,” ION ITM, 2023.
(8) U.S. DOT FAA, “Title 14 of the Code of Federal Regulations (CFR) Part 91, § 91.227 Automatic Dependent Surveillance-Broadcast (ADS–B) Out equipment performance requirements,” U.S. Government Publishing Office, 2023.
(9) U.S. DOT FAA, “Automatic Dependent Surveillance-Broadcast Operations,” Advisory Circular 90-114B, 2019
(10) U.S. DOT FAA, “Air Traffic Organization Policy: Special Use Airspace,” ORDER JO 7400.10E, 2023.
(11) Anonymous, “Aircraft Database,” Open-Sky Network documentation, 2022.
(12) S. Jada, S. Landerkin, M. Psiaki, S. Langel, A. Scholz, and M. Joerger, “Evaluation of PNT Situational Awareness Algorithms and Methods.
Authors
Dr. Mathieu Joerger
is an assistant professor at Virginia Tech. He obtained a Master’s in Mechatronics from INSA Strasbourg, France (2002) and MS (2002) and Ph.D. (2009) in Aerospace Engineering from the Illinois Institute of Technology, Chicago. He received the ION Bradford Parkinson Award in 2009, the ION Early Achievement Award in 2014, the ION Burka Award and Thurlow Award in 2023.
Chenming Fan is an undergraduate senior at Virginia Tech studying Aerospace Engineering. He holds several undergraduate research assistantships in the guidance, navigation and control field.
Sandeep Jada obtained a master’s degree (2011) in aerospace engineering from the Indian Institute of Science, Bangalore, India. He worked for Airbus India from 2011 to 2018. He is a doctoral candidate at Virginia Tech working with Dr. Joerger.


