GNSS positioning is strongly challenged in urban canyon areas. The signal reflection induces multipath and non-light-of-sight (NLOS). These signal blockages and reflections are caused by the obstacles of signal transmission between the satellites and receiver.
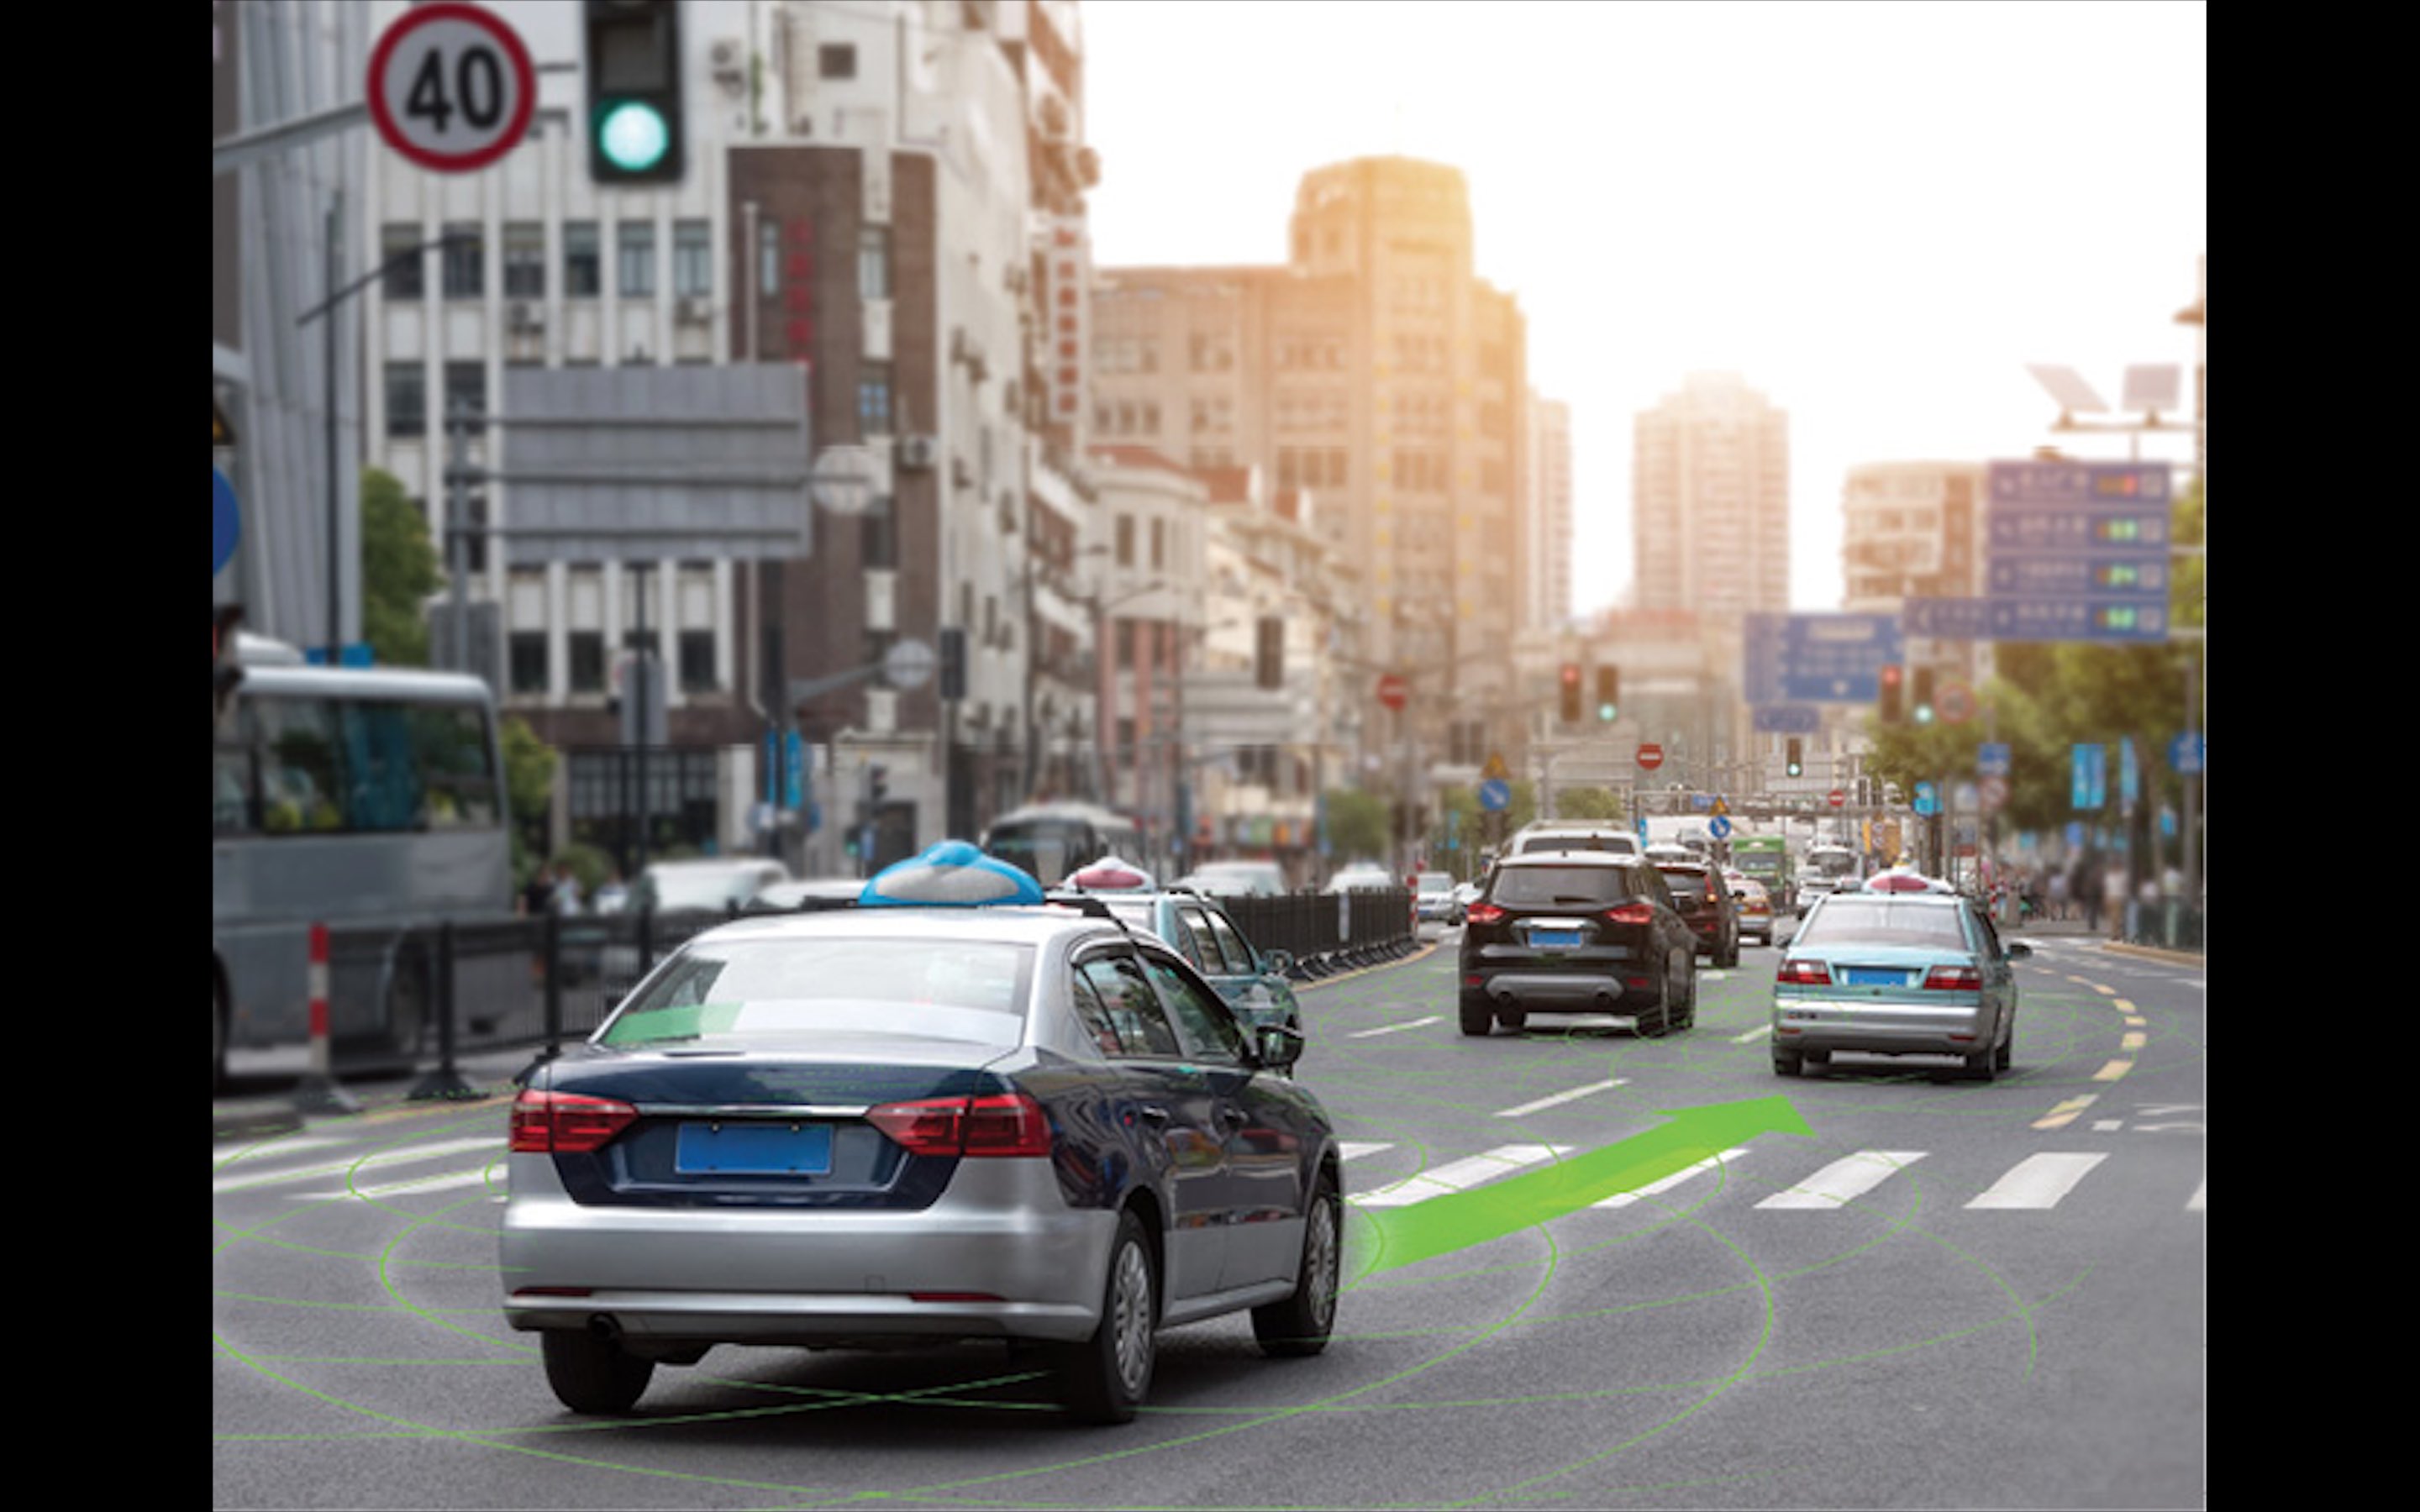
The obstacles can be buildings, trees and even a high-rise vehicle such as double-decker buses. Interestingly, they are the obstacles in urban traffic scenes. Inspiring from this, the authors propose an innovative sensor integration scheme to aid GNSS single point positioning (SPP). Taking the uprising autonomous driving as an example, instead of simply using LiDAR odometry to provide receiver movement between two data epochs, we make use of the objects detected by LiDAR and describe them in the representation of relative azimuth and elevation angles to the receiver. According to this experiment’s results, the proposed perceived environment aided GNSS SPP can improve 35% comparing to conventional weighted least square (WLS).
The level of integration is usually classified based on how “raw” the measurement is that is provided by GNSS. For example, the position and velocity are treated as loosely coupled, the pseudoranges and its rates are as tightly coupled, and I/Q correlator outputs are as ultra-tightly coupled integration. However, these integration schemes are purely considering that other sensors can only provide the system propagation in position and orientation of the vehicle.
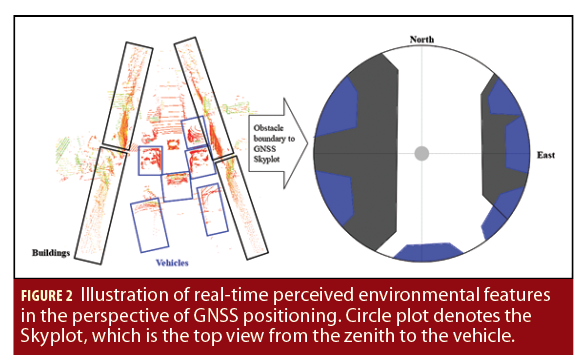
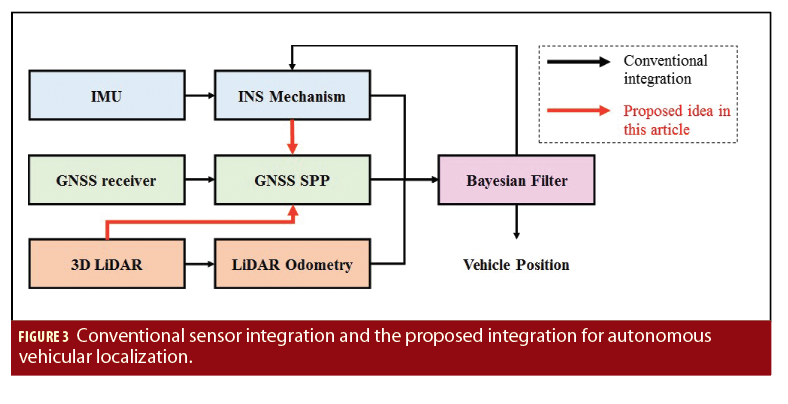
However, one opportunity has been neglected. Other than LiDAR and vision odometry, both LiDAR scanners and cameras are also used to detect surrounding objects to avoid collisions. In the other words, they can perceive the surrounding environment of a GNSS receiver in a real-time manner. This means the vehicle can obtain the location of the surrounding objects including trees, buildings and vehicles as shown in Figure 2. This article demonstrates the use of a LiDAR scanner to describe the perceived environment. According to the relative positions between the detected obstacles and ego-vehicle, their boundaries can be represented in the GNSS skyplot. Thus, we propose a new GNSS/LiDAR integration scheme to aid the GNSS single point positioning (SPP) as shown in Figure 3. Both the 3-D LiDAR and INS are employed to help the SPP.
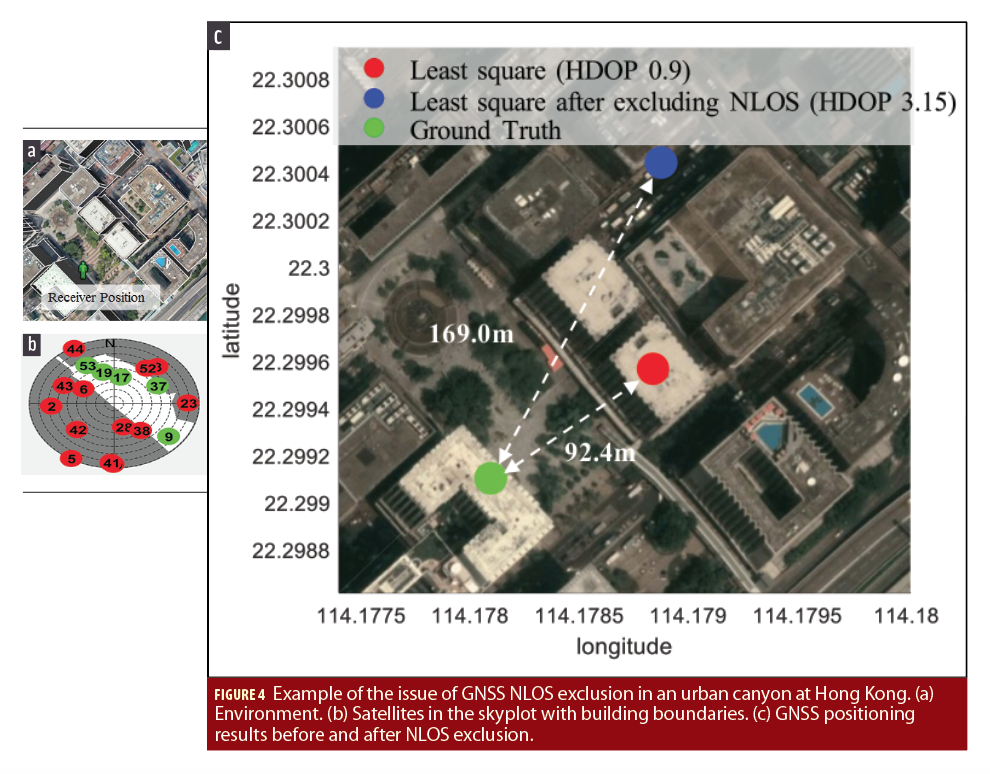
How can this perceived environment be used to aid GNSS SPP? The intuitive idea is to exclude the NLOS affected measurements from the GNSS positioning. The exclusion of NLOS measurement is very effective in less-urbanized areas. It is not the case in deep urban canyons. The dilution of precision (DOP) will be easily distorted and enlarged if excluding all the NLOS measurements received in the urban canyons as illustrated in Figure 4. Obviously, enormous NLOS measurements are received and only five LOS measurements. If we exclude all the NLOS measurements, the GPS SPP will deteriorate from 92 to 169 meters and HDOP is increased from 0.9 to 3.15. This discussion has been well-discussed in 3-D mapping aided (3DMA) GNSS (Groves 2016, Additional Resources). In fact, the famous GNSS shadow matching is proposed to deal with the same problem. The shadow matching faces other challenges as mentioned in (Groves 2012, Additional Resources). The recent state-of-the-art range-based 3DMA GNSS can correct most of the pseudorange measurement affected by NLOS receptions (see again Hsu 2018 in Additional Resources). However, the computational load of the ray-tracing simulation is immense as the simulations are required in each hypothesized position. In addition, an accurate prior-known receiver position is required by the 3DMA GNSS. To address these two issues, as an example, we present a novel method to detect the GNSS signal blockage caused by surrounding buildings and correct the NLOS pseudorange measurements based on the perceived environment features by the sensors installed on autonomous driving vehicles.
Methodology
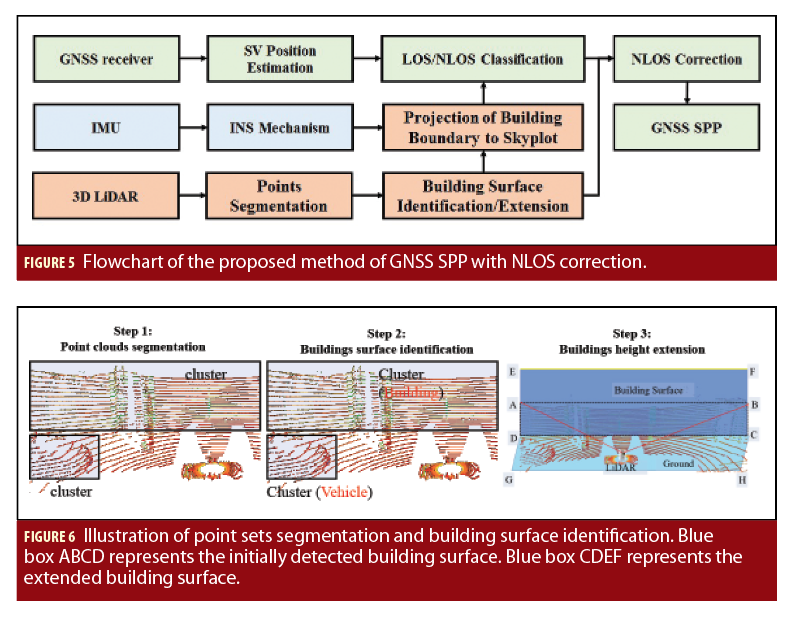
To estimate the geometry and pose of the buildings relative to GNSS receiver, a surface segmentation method is employed to detect the surrounding building walls using LiDAR 3-D point clouds. The building boundaries are extracted and extended by the building height in a skyplot to identify the NLOS affected ones from all the measurements. Innovatively, the NLOS delay in pseudorange can be modelled and corrected. Weighted least square (WLS) is used to cooperate the corrected NLOS and healthy pseudorange measurements. Figure 5 shows the flowchart of the proposed method.
The steps of the proposed method are as follows:
STEP I: Building Surface Identification and Extension
To detect the top edges of buildings (TEBs) and obtain the corresponding distances between the GNSS receiver and buildings, a point cloud segmentation method is employed to implement the building surface detection. To distinguish the building surface from the unordered points set and determine the distance from GNSS receiver to the building surface, two steps are needed: the segmentation and building surface identification. The segmentation and surface identification are described in detail as shown in Algorithms 1 and 2 in the paper by Wen, et alia in Additional Resources, respectively. The output of Algorithm is the points clusters shown in the left-hand side of Figure 6 and we do not know which cluster belongs to the buildings class. The segmentation in Algorithm 1 clusters the points into bounding box Ui which can be described as following:

where
 ,
,  and
and 
denote the position of the bounding box in x, y, and z directions in LiDAR coordinate system, respectively; roll , pitch and yawdenote the orientation of bounding box in LiDAR coordinate system.
 is the length,
  is the width and
  is the height of the bounding box.
To effectively identify the bounding box representing the building surface which can result in GNSS signal reflection and subsequent NLOS receptions, building surface identification method is needed. By the Algorithm 2, the building surface can be identified shown in the middle of Figure 6. The height of the bounding box representing building surface can be extended to the real one. In fact, this building height extension can be omitted if a sky-pointing camera is used (Suzuki and Kubo, Additional Resources). The bounding box is extended from rectangle ABCD to rectangle CDEF as can be seen in the right-hand side of Figure 6.
Then, the boundary parameters for the bounding box  corresponding to building surface are denoted by line segment
  denoted as
  , the matrix of the boundary. To represent the building, two points, E and F, are required. The is structured as follows:

STEP II: Projecting the Top Edges of Buildings into a GNSS Skyplot
To detect NLOS, visibility of satellite needs to be determined based on the extended TEBs (). The relative position of the GNSS receiver to satellites and to building surfaces needs to be transformed into the same representation, the Skyplot. Satellite position can be easily indicated in the Skyplot representation based on corresponding elevation and azimuth angles. A transformation matrix should be employed for building surface boundaries transformation from 3 dimensions coordinate to 2 dimensions coordinate. The transformation is conducted as the following formula.

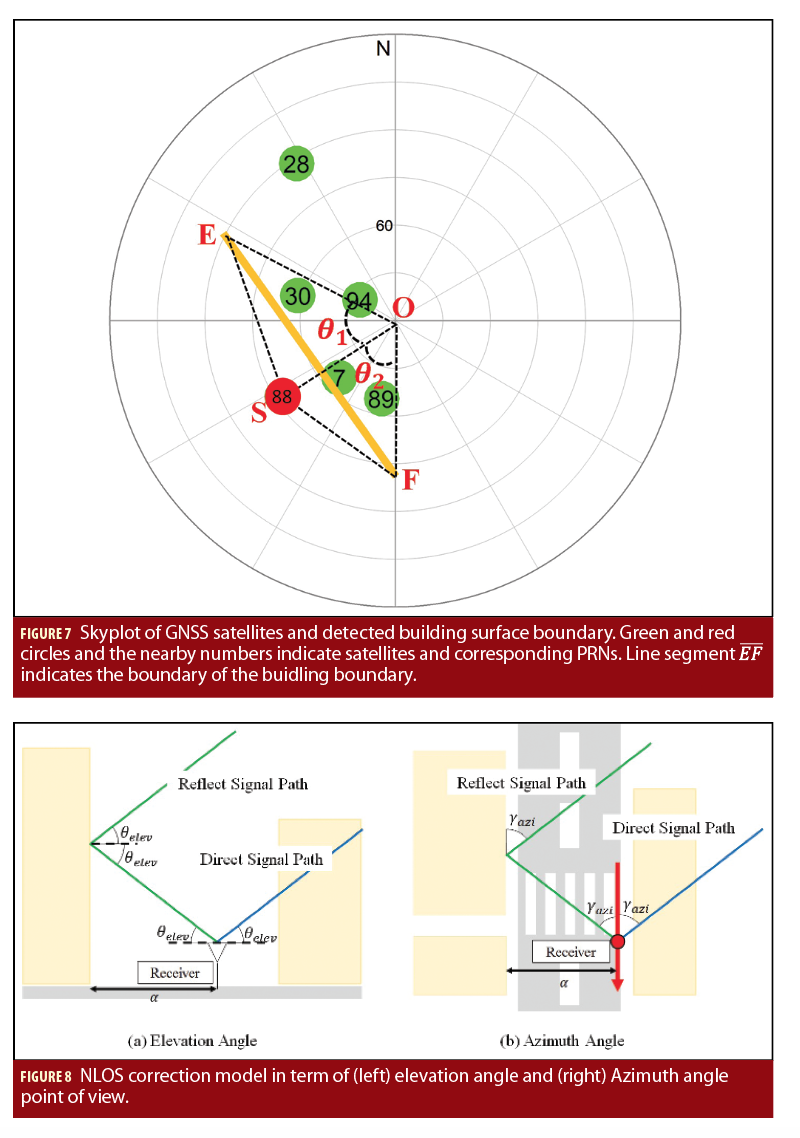
where denotes the matrix of bus boundary mentioned earlier.  is a 3×2 transform matrix. After the transformation, satellites and building surface boundary can be presented in the same coordinate. Line segment represents the building surface boundary corresponding to line segment as shown in Figure 7. Then, the azimuth and the elevation angles for point E, and F can be calculated in the Skyplot respectively.
STEP III: NLOS Correction Based on Detected TEBs
Considering satellites’ elevation angle, azimuth angle and building boundary information (elevation and azimuth angles in Skyplot), satellite transmissions blocked by building are detected. Then, NLOS correction is implemented with a NLOS error model consequently. In terms of the measurements from a GNSS receiver, each pseudorange measurement  is written as follows:

where  is the geometric range between the satellite and the GNSS receiver.
  denotes the satellite clock bias.
  indicates the receiver clock bias.
  represents the ionospheric delay distance;
  indicates the tropospheric delay distance.
  represents the errors caused by the multipath effects, NLOS receptions, and receiver noise. We focus on mitigating the NLOS errors. The NLOS error model proposed in the paper by Hsu, 2018 is expressed in Figure 8. The expected signal transmission route is expressed as dash blue line in Figure 8.
  represents the distance from receiver to the building.
  represents the elevation angle of GNSS signal. Assuming the building is vertical to the ground and GNSS signal reflection satisfied the law of reflection. As a result, the NLOS error can be calculated based on the azimuth angle, elevation angle and the distance from the receiver to the building causing the reflection. The process of NLOS correction is summarized in detail in Algorithm 3 in Wen, et alia.

Step IV: GNSS Positioning Based on Corrected Pseudorange Measurement
In this step we implemented GNSS WLS based on the corrected NLOS and healthy pseudorange measurements. Measurements with low elevation angle and SNR are more likely to be a contaminated GNSS signal, such as the multipath or NLOS, due to the reflection, blockage, and diffraction. Thus, proper thresholds need to be set to exclude the unhealthy measurements. The weighting scheme follows the suggestions from Herrera, et alia in the paper in Additional Resources.
Experiment Setup and Result
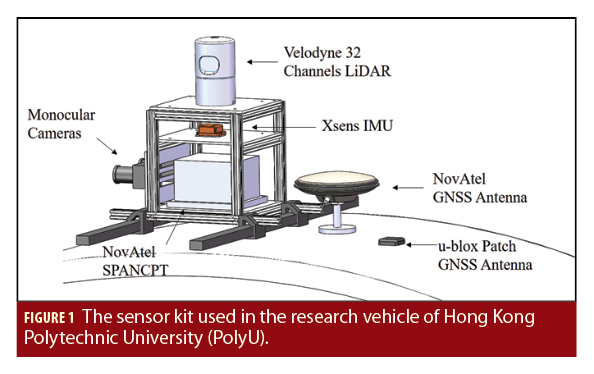
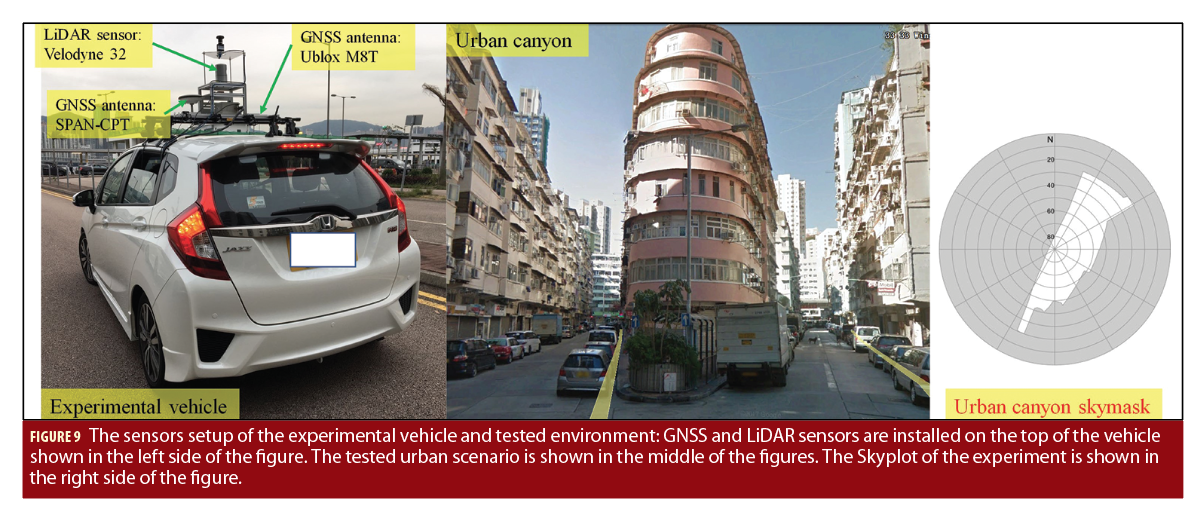
Experiments are conducted in a typical urban canyon of Hong Kong, and the experimental scene is shown in Figure 9. The Skymask in the right-hand side demonstrates the degree of urbanization. In the experiment, a receiver is used to collect raw GPS and BeiDou measurements, while a 3-D LiDAR sensor is employed to provide the real-time 3-D point clouds scanned from the surroundings. Both the receiver and the 3-D LiDAR are installed on the top of an experiment vehicle, which can be seen in left-hand side of Figure 7. The data were collected at a frequency of 1 Hz for GNSS and 10 Hz for the 3-D LiDAR. In addition, a GNSS RTK/INS (fiber optic gyroscopes) integrated navigation system is used to provide the ground truth of positioning. All the data are collected and synchronized using the Robot Operation System (ROS) (Quigley, et alia Additional Resources). Moreover, the coordinate systems of all the sensors are calibrated before the experiments. The parameters of Algorithms 1 and 2 applied in the experiments are given in (Wen et alia).
Two GNSS positioning methods are compared:
1) WLS: GNSS positioning using the WLS.
2) WLS-NC: GNSS positioning using the WLS and all the detected NLOS receptions are corrected.
Result of Building Detection using LiDAR
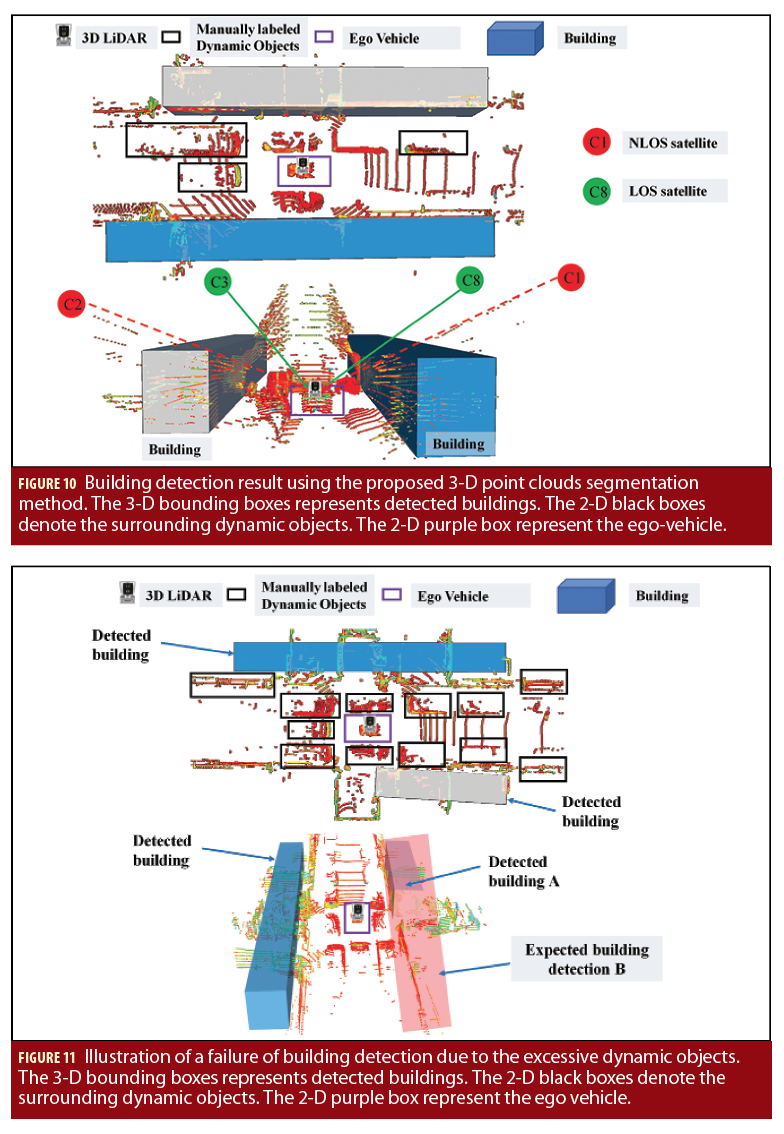
Figure 10 shows the perception result using LiDAR-based perception, namely point clouds segmentation. The colored points denote the 3-D point clouds from 3-D LiDAR sensor. The 3-D bounding boxes represent the detected buildings using the proposed method presented in Section 2. The 2-D black boxes denote the surrounding dynamic objects which are manually labeled, such as the vehicles and pedestrians. In practical use, the excessive dynamic objects can pose difficulty on the accuracy of building detection. Due to the blockage from surrounding buildings, the GNSS NLOS measurements occurred, and is shown in the bottom panel of Figure 10.
In practices, the building can be mis-detected which can be seen in bottom panel of Figure 11. The bounding box that expected to be detected is B. However, the detected bounding box is A., the main reason behind this is that the excessive dynamic objects can block the field of view (FOV) of the 3-D LiDAR and only limited part of the buildings are detected by 3-D LiDAR. As mentioned in Section 2, the 3-D LiDAR play two significant roles in the proposed method: 1) detect the buildings for satellite visibility classification; 2) ranging the distance between the GNSS receiver and potential signal reflector. According to our recent research (Xiwei, Additional Resources), we make use of the camera to capture the sky view and hence the satellite visibility can be identified. As both the camera and 3D LiDAR are indispensable sensors for the realization of autonomous vehicles, we can leverage both the LiDAR-based perception and camera to help the GNSS positioning.
Result of the Perceived Environment Aided GNSS Positioning
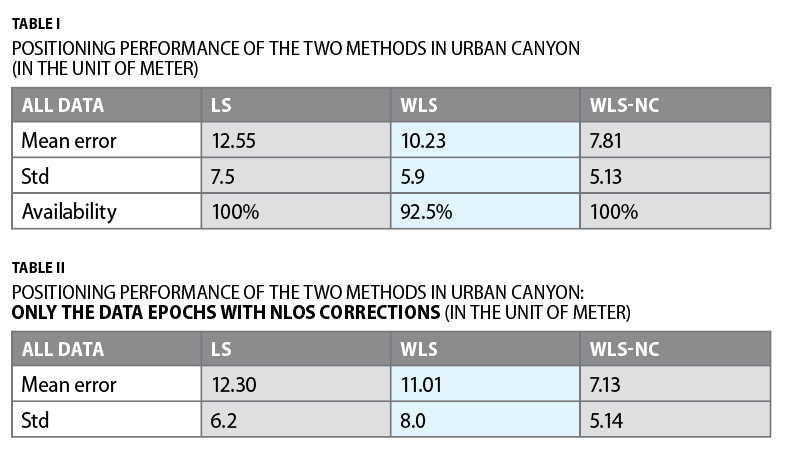
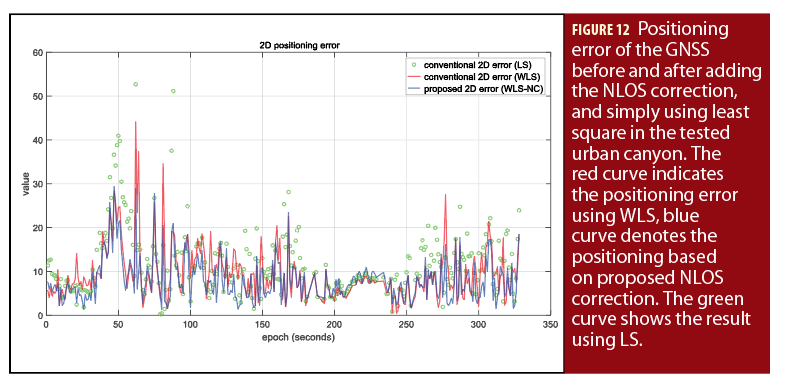
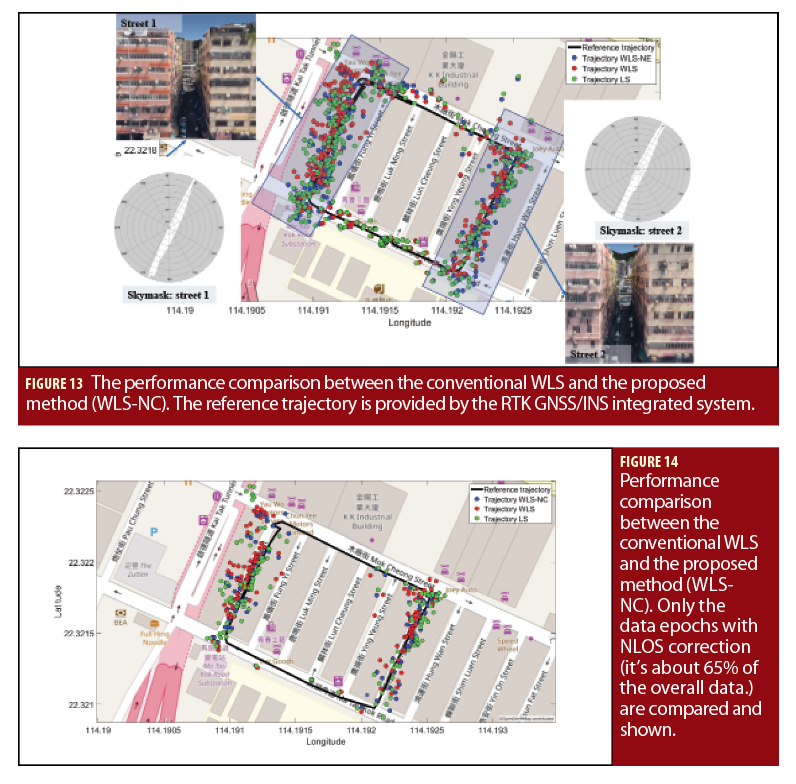
Figure 12 and Table I show the positioning results comparisons of the conventional LS, WLS and the proposed method (WLS-NC). As can be seen from Table I, GNSS positioning accuracy is gradually improved with increased constraints. Figure 12 shows positioning error during a closed-loop test. The red line represents the result using WLS method with the mean positioning error of 10.23 meters. However, the positioning error can go up to more than 30 meters in some epochs which can be seen in Figure 12. After applying the proposed perception aided NLOS correction method, the mean positioning error decreases to 7.81 meters. Moreover, all the positioning errors are less than 30 meters. The trajectory during the test is shown in Figure 13. In the left-hand and right-hand side of the trajectories, the degree of urbanization is shown using corresponding skymask which presents only very limited sky visibility.
As the NLOS correction is not available all through the test, the Figure 14 shows the trajectories only when the NLOS correction is applied. We can find that majority of the NLOS corrections occurred when the experimental vehicle drives past the dense street shown in Figure 13. Table II shows the GNSS positioning results. We can find that the mean GNSS positioning error decreasing to 7.13 meters. Moreover, the standard deviation also decreases slightly with the assist of the proposed method. Interestingly, we can find that the mean positioning error using the WLS method increases slightly from 10.23 meters in Table I to 11.01 meters in Table II. This means that the applied weighting scheme performs worse in more dense urbanized scenarios (the two dense streets are shown in Figure 13). The improved GNSS positioning results shows the effectiveness of the proposed perception aided GNSS positioning method. The proposed method relies on the result of the object detection (building detection in this paper).With the increasing perception accuracy over time, more and more environmental information can be perceived with the on-board sensors of autonomous driving vehicles. The proposed method can perform better in improving the performance of GNSS positioning.
Conclusions, Future Work
In this article, the authors demonstrate the use of LiDAR perception to aid GNSS SPP. First we detect the building using the LiDAR point cloud data and extend its height according to the height list. Then, the NLOS measurement is identified and corrected using the NLOS error model. The evaluated results show that the proposed method can improve GNSS positioning accuracy compared to that of WLS.
Table III is given to compare the proposed perceived environment aided GNSS with different state-of-the-art GNSS urban positioning methods. The methods in the first three rows make use of 3-D mapping database to improve the positioning method. Hence, all of them require the prior information of the receiver’s location to provide accurate GNSS positioning results. The proposed method requires extra sensor comparing to the 3DMA GNSS. However, these sensors are existing in most of the autonomous driving vehicles. In addition, the perception on obstacles detection is also used for the purpose online path and motion planning. The computation load for the proposed GNSS SPP is similar to that of the conventional WLS. Last but not the least, the LiDAR can provide the lateral distance which can be used to correct NLOS affected pseudorange measurement. Therefore, the HDOP remains unchanged for the proposed GNSS SPP.
The goal of this article is to raise the awareness of the perceived environment by LiDAR or camera can be used to aid positioning because the positioning sensors could be affected by the surrounding environments. Other than this demonstrated LiDAR-aided GNSS SPP, there are several setups that can use the same idea. For example, assembling the images collected from 360 degree cameras to describe the obstacles in the skyplot representation. This skyplot with obstacles can be used to identify GNSS NLOS measurement. This perceived environment aided idea can also apply to aid LiDAR positioning based on the perceived obstacles by image processing. We will work on the research of the dynamic objects removal for LiDAR positioning in the near future.
Acknowledgments
The authors acknowledge the support of Hong Kong PolyU startup fund on the project 1-ZVKZ, “Navigation for Autonomous Driving Vehicle using Sensor Integration.”
Manufacturers
In the Experiment Setup and Result section of this article, the receiver used to collect raw GPS and BeiDou measurements, is the M8T from u-blox (Thalwil, Switzerland), while the 3-D LiDAR sensor, the Velodyne 32, is from Velodyne (San Jose, California, USA). In addition, the NovAtel SPAN-CPT, GNSS RTK/INS (fiber optic gyroscopes) integrated navigation system from NovAtel (Calgary, Canada) is used to provide the ground truth of positioning.
Additional Resources
(1) Groves, P. D., (2016), “It’s time for 3-D Mapping-Aided GNSS,” Inside GNSS, September/October 2016.
(2) P. Groves, L. Wang., Marek Ziebart (2012). “Shadow Matching: Improved GNSS Accuracy in Urban Canyons.” GPS World.
(3) A. M. Herrera, H. F. Suhandri, E. Realini, M. Reguzzoni and M. C. de Lacy (2016), “goGPS: open-source MATLAB software.” GPS Solutions 20(3): 595-603.
(4) L.-T. Hsu (2018), “Analysis and modeling GPS NLOS effect in highly urbanized area.” GPS Solutions 22(1): 7.
(5) L.-T. Hsu, S. Miura, S. Kamijo Street Smart: 3D City Mapping and Modeling for Positioning with Multi-GNSS, GPS World.
(6) M. Quigley, K. Conley, B. Gerkey, J. Faust, T. Foote, J. Leibs, R. Wheeler and A. Y. Ng (2009), ROS: an open-source Robot Operating System. ICRA workshop on open source software, Kobe, Japan.
(7) T. Suzuki, and N. Kubo (2014), N-LOS GNSS Signal Detection Using Fish-Eye Camera for Vehicle Navigation in Urban Environments. ION GNSS+ 2014, Tampa, Florida.
(8) W. Wen, G. Zhang and L.-T. Hsu (2018), Correcting GNSS NLOS by 3D LiDAR and Building Height. ION GNSS+ 2018, Miami, Florida, USA.
(9) X. Bai, W. Wen, G. Zhang, L.-T. Hsu (2019), “Real-time GNSS NLOS Detection and Correction Aided by Sky-Pointing Camera and 3D LiDAR. pacific PNT conference. Hilton Waikiki Beach Honolulu, Hawaii.
Authors
Weisong Wen is currently a Ph.D. candidate at Department of Mechanical Engineering, Hong Kong Polytechnic University. In 2018, He was a visiting student in mechanical system laboratory in University of California, Berkeley. His research interests include perceived environment aided GNSS positioning and multi-sensor integrated localization for autonomous driving.
Li-Ta Hsu received B.S. and Ph.D. degree in Aeronautics and Astronautics from National Cheng Kung University, Taiwan, in 2007 and 2013, respectively. He is currently an Assistant Professor in the Interdisciplinary Division of Aeronautical and Aviation Engineering at The Hong Kong Polytechnic University. His research focus is GNSS positioning and signal processing in challenged environments.


