 Equation 1
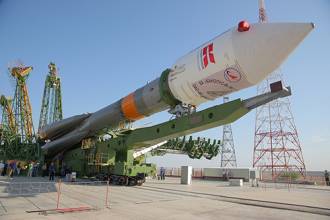
The small satellite “Technologie-Erprobungs-Träger 1” (TET-1) is the first spacecraft developed for the German Aerospace Center (DLR) On-Orbit-Verification (OOV) program, which provides flight opportunities dedicated to testing and qualification of new technologies in space. The satellite was lifted into a low-Earth orbit (LEO) on July 22, 2012, from the launch site in Baikonur, Kazakhstan.
The small satellite “Technologie-Erprobungs-Träger 1” (TET-1) is the first spacecraft developed for the German Aerospace Center (DLR) On-Orbit-Verification (OOV) program, which provides flight opportunities dedicated to testing and qualification of new technologies in space. The satellite was lifted into a low-Earth orbit (LEO) on July 22, 2012, from the launch site in Baikonur, Kazakhstan.
TET-1 carries various technology demonstration payloads, among them the Navigation and Occultation eXperiment (NOX). This payload consists of a geodetic-grade GPS receiver, which is connected via an antenna selector to two GPS L1/L2 patch antennas.
One of the antennas is mounted on the satellite’s zenith panel and receives signals primarily used for precise orbit determination (POD) experiments. The second antenna is pointed towards the anti-flight direction of the satellite for collecting measurements of low elevation satellites for ionospheric and tropospheric occultations. The antenna switch allows to select either the POD or the occultation antenna for signal reception.
This article describes the NOX payload on board the TET satellite in detail and analyzes the receiver’s tracking performance and the accuracy of its navigation solution. It also presents the initial tracking results of the occultation antenna, which demonstrate that GPS signals can be tracked through the ionosphere below the satellite’s local horizon — at a minimum, even down to the upper part of the atmosphere — with commercial-off-the-shelf (COTS) equipment.
Spacecraft Design & Operation
The spacecraft bus for TET is based to a large extent on the Bi-Spectral Infra-Red Detection (BIRD) satellite bus. The satellite has a height of 880 millimeters and a depth of 670 millimeters. In launch configuration, TET-1’s width is 580 millimeters, which increases to 1,540 millimeters with the solar panels deployed. Its total mass is approximately 120 kilograms, which includes 50 kilograms of payloads.
TET-1 is equipped with star sensors, sun sensors, gyroscopes, and magnetic field sensors for attitude determination. A set of four reaction wheels and magnetic coils provides three-axis stabilization. The satellite bus system is equipped with a single-frequency receiver with its own dedicated patch antennas. Note that this system, which provides positioning and timing for the satellite bus, is completely independent from the NOX payload. The satellite carries 11 payloads in total, including the NOX, which has been designed to demonstrate the suitability of COTS technology for space applications.
Figure 1 shows a schematic illustration depicting the front view of the TET-1 satellite without its multi-layer insulation. The figure shows the various components of NOX, which will be discussed in further detail in the following section, and illustrates the orientation of the body-fixed coordinate system of the satellite.
The TET-1 satellite is operated in different attitude modes depending on the payload operation or mission requirements. The two attitude modes relevant for the operation of the NOX system are the Earth-pointing mode (EPM) and the Sun-pointing mode (SPM). In the EPM, the satellite’s body-fixed “+x”-axis points into the direction of flight and the “+z”-axis is oriented towards the center of the Earth. The SPM is used to recharge the satellite batteries. For this purpose, the satellite’s solar panels, which are mounted on the “-z”-panel are pointed towards the Sun to maximize their power output.
TET-1 was launched into a sun-synchronous LEO orbit at a height of approximately 500 kilometers with an inclination of 97.5 degrees on July 22, 2012. After testing all satellite subsystems and payloads during the commissioning phase after launch, the OOV mission was conducted until October 2013. The satellite still continues operation and is now part of the Firebird mission, with the task of fire detection from orbit.
Overview of the NOX
The Navigation and Occultation eXperiment on TET-1 has been designed to demonstrate the suitability of commercial-off–the-shelf technology for space applications. Figure 2 provides a schematic of the NOX hardware layout. The experiment consists of a dual-frequency GPS receiver connected to an RF relay, which allows operators to select one of two L1/L2 passive patch antennas for signal tracking. A low noise amplifier (LNA) with a gain of 26 decibels at the L1 and L2 frequencies is used to ensure an adequate signal strength at the receiver input.
The receiver is standard off-the-shelf hardware. Standard receiver firmware, however, cannot be used for spaceborne applications, because height- and velocity-constraints prohibit the operation on board a satellite. The NOX receiver is therefore equipped with a special firmware with these NATO limits removed. In addition to these modifications, the Doppler search window has been increased 45 kilohertz to facilitate signal acquisition under high dynamics.
With its 48 channels the receiver can track L1 C/A code and L1/L2 P(Y) code signals of 16 satellites simultaneously. It provides pseudorange, carrier-phase, Doppler, and carrier-to-noise density ratio (C/N0) observations for L1 C/A and L2 P(Y) signals and as well as pseudoranges and C/N0 for L1 P(Y) at data rates of up to 10 Hz.
The receiver underwent extensive pre-flight testing to ensure its suitability for use in space. The papers by J. Leyssens et alia and M. Garcia-Fernandez, listed in the Additional Resources section near the end of this article, describe this testing in further detail. The receiver board is mounted together with an interface (IF) board on the “-y”-panel of the payload compartment of the satellite as shown in Figure 1. The interface board serves as the power and commanding interface between NOX and the TET satellite bus. It also contains a protection circuit against single-event latch-up effects and a switch line, which allows the operation of the RF relay for antenna selection.
The antennas of NOX are two identical patch antennas, which are mounted on different sides of the satellite bus structure without dedicated ground planes or choke rings. The antenna used for precise orbit determination is mounted on the “-z”-panel of the satellite. The POD antenna points towards zenith, when TET-1 is operated in Earth-pointing mode. This attitude is therefore preferred for the operation of the navigation system, because it maximizes the visibility of GPS satellites.
Restrictions of the battery capacity, however, require TET-1 satellite to be operated in Sun-pointing mode for recharging when it is not in the Earth’s shadow. As a result, the POD antenna’s boresight vector does not always point towards zenith, but deviates significantly from the local zenith vector during parts of the orbit when the batteries are charged. As a result, the antenna’s field of view will be obstructed by the Earth, which limits the number of satellites available for tracking. We will show, however, that the NOX payload can still provide robust navigation solution most of the time.
The second antenna for radio occultation is mounted on the “-x”-panel. It points towards the Earth’s horizon in anti-flight directions when the satellite is in Earth-pointing attitude mode. This antenna orientation facilitates the tracking of GPS signals through the Earth’s atmosphere for GPS radio occultation (RO) measurements, which we will discuss in more detail later.
As only one antenna can be used at a time, the LEO orbit and clock offset determination during occultation experiments is performed using measurements of the occultation antenna. This is a simplified concept compared to most modern RO missions, which use a dedicated navigation antenna in parallel to one or more occultation antennas.
We should mention that the RO experiment of NOX is not intended to routinely provide data for weather prediction or climate research. Its purpose is merely to demonstrate the capabilities and limitations of current COTS hardware, along the lines of a similar experiment conducted on board the MicroLab 1 in 1995 and described in the article by R. Ware et alia.
Receiver Performance
In the following subsections, we analyze the in-flight performance of the GPS receiver and the antenna system with respect to activation behavior and signal tracking characteristics. Where available, the on-orbit results are compared to pre-flight tests with a signal simulator.
Receiver Start-Up Behavior. Unlike the GPS receiver on the satellite bus, which is operated continuously during the entire mission, the NOX receiver is only activated during dedicated experiment time slots typically once a week. The experiments have a varying duration between 12 and 24 hours. The receiver is only supplied with power during these intervals and otherwise is completely switched off.
Upon activation at the beginning of an experiment’s time slot, the receiver starts to search for satellite signals. The receiver’s non-volatile memory still contains the last valid position solution, broadcast almanacs and navigation data obtained before the last deactivation. In the case of the NOX receiver, this information is used to compute a list of visible satellites, which are prioritized in the signal search. If this warm start acquisition fails because no satellite has been acquired after 45 seconds, a sequential search over the full GPS constellation is performed instead until a position fix could be successfully computed.
The receiver’s time to first fix (TTFF) is an important performance measure. The histogram in Figure 3 shows the TTFF statistics for 20 receiver activations using the POD antenna. These data indicate that the receiver has achieved a first position fix after less than two minutes in more than half of the cases. Note that this includes the time necessary for receiver boot and self-test.
The shortest and longest TTFF encountered in the 20 receiver activations are 85 seconds and 189 seconds, respectively. The mean and standard deviation of the TTFF is 2.03 ± 0.50 minutes, which show good agreement with values obtained from hardware-in-the-loop tests using a signal simulator. The TTFF for the simulated scenario yielded a mean and standard deviation of the TTFF of 2.56 ± 0.50 minutes, as described in the article by J. Leyssens et alia. The short TTFF clearly shows the benefits of a smart signal-search concept and optimal use of the 48 channels during acquisition.
It is interesting to note that the receiver has never acquired a position fix within the first 45 seconds of activation, meaning that the first fix has always been achieved after a signal search over the full constellation. Using almanac and navigation solution information from previous fixes during a warm start is obviously not helpful due to the long interruptions between consecutive activations of the NOX payload.
Tracking Performance. The number of simultaneously tracked satellites is a key parameter to determine the availability of a navigation solution. Figure 4 shows the statistics for the number of satellites tracked on L1 C/A-code and L2 P(Y)-code signals over the entire period of time when NOX was activated using the POD antenna. Statistics for L1 P(Y)-code are not displayed, because they are virtually identical with L2 P(Y) results.
The figure shows clearly that the receiver tracks between 8 and 12 satellites most of the time, which provides sufficient redundancy for a robust computation of a navigation solution. These results are consistent with results from signal-simulator tests. The peak for P(Y)-code is shifted slightly towards a lower number of simultaneously tracked satellites compared to C/A-code, which reflects a lower sensitivity and deferred acquisition of the semi-codeless tracking of P(Y)-code.
The receiver tracks four or more satellites for 99.99 percent of the time on C/A-code and 99.73 percent of the time on P(Y)-code. We can thus conclude that the receiver has a high availability of single- and dual-frequency navigation solutions.
In order to assess the measurement quality of the NOX receiver and antenna system, we analyzed the carrier-to-noise-density ratio (C/N0). Figure 5 depicts a polar plot of the carrier-to-noise-density ratio (C/N0) for C/A-code measurements based on 24 hours of data recorded on August 30, 2012, using the POD antenna. The coordinate axes in Figure 5 are aligned with the local frame of the antenna, which exhibits a different orientation than the satellite’s body-fixed coordinate axes.
The measured C/N0 ranges from 30 dB-Hz near the horizon to approximately 50 dB-Hz at higher elevation angles. The C/N0 pattern is not rotationally symmetric, but exhibits a clear azimuthal dependency. This effect is especially pronounced on the left side of the diagram and results most likely from the mounting position of the antenna close to the edge of the panel. Without a choke-ring or a dedicated antenna ground plane, the non-uniform satellite structure affects the gain pattern of the antenna.
Accuracy of Navigation Solution. The NOX receiver computes a navigation solution based on dual-frequency pseudorange observations and outputs results at intervals of 30 seconds. The receiver’s internal position filter has been turned off in the NOX experiment; thus, the reported positions correspond to independent epoch-by-epoch navigation solutions.
The errors of the receiver navigation solution are assessed by a comparison with a precise reference trajectory from a reduced-dynamic orbit determination based on carrier-phase measurements. In the next section we will provide more details on how the reference trajectory has been obtained.
For our analysis, we selected navigation solution results from a period of almost 24 hours on August 30, 2012. Figure 6 shows the errors in radial, tangential (in the direction of flight), and normal directions with respect to the orbital coordinate frame with the corresponding statistics listed in Table 1.
It becomes obvious that the errors of the radial component exhibit the largest scatter, which is an expected result, because the vertical component is always most affected by the largest dilution-of-precision in a single-point solution.
For the majority of the epochs, the radial errors fall between ± 5.0 meters, whereas the tangential and normal components are typically less than ± 2.5 meters. At one epoch, though, the radial error reaches 13.81 meters.
When interpreting these results, it is important to note that the reference solution refers to the satellite’s center of mass whereas the receiver’s navigation solution refers to the antenna phase center. The offset between these two points is on the order of 0.66 meter and is projected differently on the radial-, tangential-, and normal-coordinates, depending on the satellite attitude, and affects the error statistics.
Nevertheless, we can conclude that the receiver typically provides navigation solutions with meter-level accuracy. The satellite has alternately been operated in Earth-pointing mode during eclipse and otherwise in Sun-pointing mode. Despite the possible obstruction of the antennas field of view in Sun-pointing attitude mode, the receiver has provided continuous navigation solutions for the entire time due to its high number of tracking channels and fast acquisition of satellites.
POD Performance
In this section, we will present the results of precise orbit determination of NOX. Here we will briefly introduce the orbit determination process. As no reference solution is available for the satellite’s orbit, overlap comparisons serve as a metric to assess accuracy of the POD results. A phase-center pattern for the NOX POD antenna computed from carrier-phase residuals is also presented.
Reduced Dynamic Orbit Determination. Precise orbit solutions have been computed using measurements from the satellite’s POD antenna at an update rate of 30 seconds. As a first a priori trajectory, a single point solution based only on pseudorange measurements is computed. This coarse trajectory is smoothed using a least-squares filter to fit the satellite positions to a dynamic orbit model. This smoothed orbit is then used as an a priori orbit for a reduced dynamic orbit determination, where pseudorange and carrier-phase measurements are processed in a least-squares filter with a dynamical orbit model.
The estimation parameter vector comprises the satellite position and velocity state at the reference epoch, a scaling factor for the accelerations due to solar radiation pressure and atmospheric drag, as well as the ionosphere-free carrier-phase float ambiguities. Further, empirical accelerations in radial, along-track, and cross-track direction are estimated to compensate for deficiencies in the deterministic model. A more detailed description of the POD procedure and the orbit model can be found in the article by O. Montenbruck et alia cited in Additional Resources.
As a more precise reference solution or independent measurements from satellite laser ranging are not available, a direct assessment of the errors in the precise orbits is not possible. Therefore, orbit overlap comparisons are used here to yield at least an indication of the orbit quality. For this purpose, we computed 19 orbit solutions based on a data arc of five hours on August 30, 2012. The first hour of each orbit solution with the central hour of a previous orbit solutions, starting two hours earlier.
The mean values of the pseudorange residuals are consistently between 70 and 75 centimeters for all 19 POD runs. The carrier-phase residuals are two orders of magnitude smaller and vary between 7.5 millimeters and 8.5 millimeters. Figure 7 presents the results for the 3-D RMS overlap errors. The maxi-mum and minimum errors are 35 millimeters and 5 millimeters, respectively, with an average of 18 millimeters.
Experience shows that the inclusion of empirical accelerations in the estimation leads to a reduced stiffness of the solution, which allows the estimated trajectory to closely follow the observations. As a result, the overlap comparisons tend to be too optimistic and the true orbit errors can be expected to be larger. Based on experience of previous missions with dual-frequency GPS receivers, we would expect the achievable 3-D RMS accuracy to be on the order of decimeters or better.
Antenna Phase Pattern. Inspection of the carrier-phase residuals from the reduced dynamic orbit determination has revealed clear systematic effects with azimuth- and elevation-dependent variations. These systematic residuals are due to antenna phase pattern variations of the receiving antenna caused by the effect of the satellite’s structure on the antenna in the absence of a choke ring or ground plane.
An antenna phase-center variation pattern can be derived based on carrier-phase observations processed over a longer time interval. For this purpose, we grouped the residuals of the POD into azimuth and elevation bins depending on the direction of the received signal. The phase center variation correction is then computed as the average of the residual in this bin. The resulting phase pattern correction is then used again for a POD and refined with corrections based on the residuals of further iterations.
Figure 8 depicts the results for the POD antenna based on the data of all NOX activations between August and December, 2012. The maximum amplitude of phase center variations is ± 25 millimeters. The phase pattern exhibits an irregular shape with rapid changes between maximum and minimum variations. The standard deviation of the carrier-phase residuals in the POD can be reduced from 12 millimeters to 8 millimeters using this correction pattern.
Radio Occultations
During a radio occultation (RO), the signal of a GNSS satellite is tracked by a receiver on the opposite side of the Earth close to the horizon. Because the signal is received through the Earth’s atmosphere, it is affected by delays and bending depending on the refractivity of the atmospheric layer.
The refractivity can be approximated as a function of total-electron content in the ionosphere as well as temperature, pressure, and humidity in the troposphere. We can compute the bending angle and the corresponding ray height of the signal from carrier-phase measurements, which allows us to retrieve the refractivity index and solve for atmospheric and ionospheric parameters.
Due to the change in geometry between the two satellites, the signal is received through different layers of the atmosphere during an occultation event. If high rate carrier-phase measurements are available, bending angle profiles for different altitudes can be recorded. The derived atmospheric parameters serve as input data for weather prediction and climate research, which are the main motivations for radio occultations.
Figure 9 presents a schematic of a radio occultation. The GNSS and the LEO satellite travel with velocities of vs and vr, respectively. The direct straight-line connection between the LEO satellite and the GNSS satellite determines the straight-line tangent altitude (SLTA), which is the distance of this line to the surface of the Earth.
Due to the bending, the actual signal path does not follow this straight-line connection, but is curved around the Earth at an impact height a. This curvature is characterized by the bending angle α at the corresponding impact height. Due to the signal bending, the receiver can still track the GNSS satellite, even though it may be below the Earth’s horizon as seen from the LEO satellite. However, note that the bending depicted in the plot is highly exaggerated and does in reality not exceed one degree.
The fundamental relation to be solved for in RO processing is the dependency of the bending angle on the impact height. For this purpose, the carrier-phase measurements are corrected for geometrical range between LEO and GNSS satellite, receiver and GNSS satellite clock offsets, and relativistic effects, which only leaves the delays due to ionosphere and troposphere.
This residual is referred to as the excess phase delay. The LEO orbit and the clock offset corrections are obtained from a POD using the occultation antenna. The bending angle can then be retrieved from the change in excess phase, referred to as the excess Doppler, and the LEO and GNSS satellite velocity.
Figure 10 shows results for an occultation event of GPS satellite SVN 47 (PRN 22) on September 2, 2013, between approximately 17:42 and 17:48 UTC. The tangent point coordinates of the occultation are 28.18° S and 82.81° E, which correspond to a location in the Indian ocean, halfway between Madagascar and Western Australia. GPS measurements have been taken with a data rate of five hertz.
The top plot in Figure 10 shows the signal-to-noise density ratio (C/N0) for L1-C/A code and L2-P(Y) code together with the straight-line tangent altitude. The plot starts at an SLTA of approximately 500 kilometers, where the signal of the GPS satellite is tracked through the upper ionosphere. The C/N0 is practically constant at 46.6 dB-Hz and 33.3 dB-Hz for C/A and L2-P(Y), respectively, for almost the entire period of time.
Only during the last 30 seconds of tracking at an SLTA of 50 kilometers and less, the C/N0 starts to drop and exhibit larger variations due to the signal attenuation in the lower atmosphere. Also note that the L2-P(Y) tracking is disrupted earlier than L1 C/A.
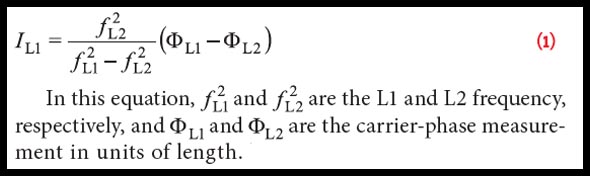
The bottom of Figure 10 plot shows the corresponding excess carrier-phase for L1 and L2 together with the slant ionospheric delay computed from dual-frequency carrier-phase measurements. The slant ionospheric delay for the L1 frequency IL1 has been computed from
Equation (1) (see inset photo, above right)
. . . This geometry-free carrier-phase combination removes all frequency-independent terms such as geometry, clock offsets, and tropospheric delay. The delay has the positive sign convention of the pseudorange delay, even though it has been computed from carrier-phase measurements.
Note that the ambiguities and frequency-dependent signal delays do not cancel out in Equation 1. Therefore, the absolute value of the ionospheric delay cannot be recovered, but only the temporal variation.
As expected, the ionospheric delay is smallest at high altitudes, where the electron content is low. As the signal path proceeds into the lower ionosphere, the delay increases and reaches a peak at a straight-line altitude of approximately 300 kilometers. For lower tangent altitudes, the delay decreases again. The maximum amplitude of the ionospheric delay variation over the data arc is about five meters, or ~30 total electron content (TEC) units. Since the measurements were taken on the dark side of the Earth, the ionospheric electron content is low.
The excess phases for L1 and L2 depicted in the bottom plot of Figure 10 show a maximum amplitude of ~240 meters for a straight-line tangent altitude of -20 kilometers, where the signal is tracked through the lower part of the atmosphere. At higher altitudes, only small variations of the excess phases due to the ionospheric delays are present. As a result, the bending angle is small at high altitudes and increases rapidly as soon as the signal path enters the troposphere.
If the excess phases of Figure 10 are converted into excess Dopplers, the bending angle of the signal can be computed as a function of the impact height. Figure 11 depicts the corresponding results for the L1 and L2 frequency. The plot shows that the bending angle for the L1 and L2 frequency differ due to the frequency-dependent ionospheric delays. In order to remove this effect, an ionosphere-free (or neutral) bending angle (LC) has been computed as a linear combination of the L1 and L2 bending angles at the same impact height.
The minimum impact height for this occultation is approximately 7 kilometers. The bending angle at this height is approximately 0.6 degree. For higher altitudes, the bending angle decreases until it reaches a level of about 0.001 degree for impact heights larger than 50 kilometers. The bending angles exhibits only very low noise for impact heights lower than 40 kilometers.
At higher altitudes, the noise increases significantly. The reason for the different noise levels becomes clear from the plot of the excess phases in Figure 10. For high altitudes, the signal delays are small, and measurement noise and model imperfections dominate. Apparently, bending angles less than 0.001 degree cannot be observed, because they are below the noise floor in the current processing. When the signal crosses the troposphere, the delays grow quickly with decreasing impact height and become distinguishable from the noise.
Summary and Conclusions
This article as presented initial flight results of the Navigation and Occultation eXperiment on-board the small satellite TET-1. The experiment has demonstrated that commercial-off–the-shelf hardware can be used in space-borne applications, with only minor changes to the receiver’s firmware.
With the height and velocity constraints removed and an increased Doppler search window, the receiver has reliably acquired and tracked sufficient satellites for a continuous navigation solution, typically within less than three minutes. The 3-D RMS errors of the navigation solutions are on the order of a few meters only. No latch-ups or other receiver failures have been observed during the entire mission.
Plots of the C/N0 variation and the phase pattern variations in the antenna diagram indicate an effect of the satellite’s structure on the antenna characteristics. If a ground plane or choke ring is used to mount the antenna, these effects can be expected to be less pronounced.
In the absence of a more precise reference solution or independent measurements, for example from satellite laser ranging, the precise orbit determination accuracy cannot be directly assessed. Orbit overlap comparisons have shown errors of a few centimeters, between the first hour and the central hour a two five-hour orbit arcs. The use of an empirically derived correction pattern for phase center variation could reduce the carrier-phase residuals of the POD, typically from 12 millimeters to 8 millimeters.
Radio occultation experiments have shown that dual-frequency carrier-phase signals can be tracked through the Earth’s troposphere with a data of five hertz. The data enables researchers to monitor the ionospheric delay and derive slant TEC variations of the upper atmosphere. A bending angle profile for L1 and L2 carrier-phase measurements has been derived in the troposphere down to an impact height of about seven kilometers.
The NOX experiment proves that a low-cost GPS system, which fulfills the requirements for precise orbit determination, can be realized with COTS hardware. This approach may be appealing for research groups seeking to gain inexpensive access to relevant data and even help to identify possibilities for cost reduction in future satellite missions.
Analysis of NOX RO observations has demonstrated that GPS signals could be tracked through the ionosphere and troposphere below the satellite’s horizon. We must note, however, that the performance of this setup not sufficient to produce RO data ready to be used for use in weather forecast or climate research. Several special modifications — such as open-loop tracking, an autonomous occultation prediction and channel allocation algorithm in the receiver, and a higher sampling rate as well as a high-sensitivity antenna system — would be needed to make this system competitive to modern RO payloads.
Acknowledgments
The authors would like to acknowledge the contributions of their former colleagues Cécile Renaudie and Miquel Garcia-Fernandez, who have worked on the design and manufacturing of the NOX experiment. The support of colleagues at Kayser-Threde GmbH during the design, implementation, and operation of NOX payload is greatly appreciated. The team at Septentrio is acknowledged for technical support and discussions.
The authors would also like to thank the TET operations team at the German Space Operations Center, especially Andreas Spörl, Andreas Pohl, and Jens Richter, for their help in planning and implementing the NOX experiments. DLR Space Administration is acknowledged for the free flight opportunity of the NOX experiment on-board TET-1.
This article is based primarily on a paper presented at the ION GNSS+ 2013 conference in Nashville, Tennessee, USA.
Additional Resources
[1] Eckert, S., and S. Ritzman, J. Eckler, and W. Bärwald,” “On-Orbit Verification with a Technology Test Carrier TET,” in Proceedings of 6th IAA Symposium on Small Satellites for Earth Observation, Berlin, Germany, April, 23–26, 2007
[2] Föckersperger, S. and G. Staton, and M. Turk, “Future Small Satellite EO Missions Based on TET,” in Proceedings of the Small Satellites Systems and Services Symposium 2012, Portorož, Slovenia, June 4–8, 2012
[3] Garcia-Fernandez, M., and O. Montenbruck, M. Markgraf, and J. Leyssens, “Affordable Dual-frequency GPS in Space,” in Proceedings of the 6th International ESA Conference on Guidance, Navigation and Control Systems, Loutraki, Greece, October 17–20, 2005
[4] Gleason, S., and D. Gebre-Egzabher, GNSS: Applications and Methods, Artech House, Norwood, Massachusetts, USA, 2004
[5] Hajj, G.A., and E. R. Kursinski, L. J. Romans, W. I. Bertiger, and S. S. Leroy, “A technical description of atmospheric sounding by GPS occultation,” Journal of Atmospheric and Solar-Terrestrial Physics, 64:451–469, 2002. doi: 1364-6826/02/
[6] Kursinski, E. R., and G. A. Hajj, J. T. Schofield, R. P. Linfield, and K. R. Hardy, “Observing Earth’s atmosphere with radio occultation measurements using the Global Positioning System,” Journal of Geophysical Research, 102(D19):23,429–23,465, 1997. doi: 0148-0227/97/97 JD-01569
[7] Lemke, N. M. K., and C. Kaiser, S. Föckersperger, G. Staton, and T. Stuffler, “TET-Based Small Satellite Family,” in Proceedings of the 63rd International Astronautical Congress, Naples, Italy, October 1–5, 2012
[8] Leyssens, J., and and M. Markgraf, “Evaluation of a Commercial-Off-The-Shelf Dual-Frequency GPS Receiver for Use on LEO Satellites,” in Proceedings of the ION GNSS, Long Beach, California, USA, September 13–16, 2005
[9] Markgraf, M., and C. Renaudie, and O. Montenbruck, “The NOX Payload-Flight Validation of a Low-Cost Dual-Frequency GPS Receiver for Micro- and Nanosatellite Applications,” in Proceedings of the IAA Symposium on Small Satellite Systems and Services (4S), Rhodes, Greece, May 26–30, 200.
[10] Markgraf, M., and P. Swatschina, “The Navigation and Occulation eXperiment (NOX) onboard TET-1,” presented at 2nd TET Customer Day, Kayser-Threde, Munich, Germany, July 5, 2010
[11] Melbourne, W.G., and E. S. Davis, C. B. Duncan, G. A. Hajj, K. R. Hardy, E. R. Kursinski, T. K. Meehan, L. E. Young, and T. P. Yunck, The Application of Spaceborne GPS to Atmospheric Limb Sounding and Global Change Monitoring, JPL Publication 94-18, 1994
[12] Montenbruck, O.,l and T. van Helleputte, R. Kroes, and E. Gill, “Reduced dynamic orbit determination using GPS code and carrier measurements,” Aerospace Science and Technology, 9(3):261–271, 2005. DOI 10.1016/j.ast.2005.01.003
[13] Ware, R., and M. Exner, D. Feng, M. Gorbunov, K. Hardy, B. Herman, Y. Kuo, T. Meehan, W. Melbourne, C. Rocken, W. Schreiner, S. Sokolovskiy, F. Solheim, X. Zou, R. Anthes, S. Businger, and K. Trenberth, “GPS Sounding of the Atmosphere from Low Earth Orbit: Preliminary Results,” Bulletin of the American Meteorological Society, 77, 19–40. DOI 10.1175/1520-0477(1996)077<0019:GSOTAF>2.0.CO;2
[14] Yoon, Z., and T. Terzibaschian, C. Raschke, and O. Maibaum, “Robust and Fault Tolerant AOCS of the TET Satellite,” in Proceedings of the 7th IAA Symposium on Small Satellites for Earth Observation, Berlin, Germany, May 4–7, 2009


