2017 and 2018 saw unprecedented GNSS interference activity, from the eastern Mediterranean to Norway and Finland. Syria emerged as a testbed for electronic warfare capabilities. In April 2018, General Raymond Thomas, commander, U.S. Special Operations Command, referred to the region as “the most aggressive electronic warfare environment on the planet.”
By Matthew Murrian, Lakshay Narula, Todd Humphreys, Brady O’Hanlon and Scott Budzien
Space-based observation of terrestrial GNSS interference offers world-wide coverage. Sensing in low-Earth orbit (LEO) offers sufficient stand-off distance from terrestrial interference sources to permit tracking authentic GNSS signals, allowing precise position, velocity, and timing of a LEO receiver to be determined, which, in turn, aids estimation of interference transmitter locations.
A single LEO-based sensor is sufficient to characterize the strength, spectral properties, structural content, and even the location of terrestrial interference sources, provided a Doppler time history can be extracted from some component of the interference signal. Through time- or frequency-difference of arrival techniques, multiple synchronized LEO-based sensors could additionally provide location information for interference sources from which no carrier can be extracted.
This article presents the results of a two-year study of terrestrial GNSS interference as observed through a software-defined GNSS receiver operating since February 2017 on the International Space Station (ISS). The Fast, Orbital, TEC, Observables, and Navigation (FOTON) receiver, developed by The University of Texas at Austin and Cornell University, is part of a larger science experiment called GPS Radio Occultation and Ultraviolet Photometry—Colocated (GROUP-C), an unclassified experiment aboard the ISS. Serendipitous observations of GNSS interference in the occultation data are an important early result of GROUP-C’s scientific objective to characterize GPS signals in the LEO environment.
Three levels of FOTON data are available for interference analysis:
- raw 5.7 Msps IF samples output by the FOTON front-end’s analog-todigital converter
- 100-Hz data-modulation-wiped complex IQ correlation products, and
- 1-Hz standard GNSS observables.
We focus here on interference observationsextracted from raw IF samples and 1-Hz standard observables, and introduce theconcept and analyze expected performance for terrestrial GNSS interference monitoring from LEO. We show results of a 2-year study of global GNSS interference, with emphasis on a powerful source active in Syria in 2018.
LEO Interference Monitoring Performance SENSITIVITY AND DETECTION. A simple and effective interference detection test can be formulated solely from the standard carrier-to-noise density ratio,  produced by a GNSS receiver. In the
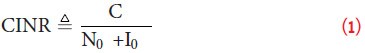
presence of interference, actually measures the carrier-to-interferenceand- noise density ratio, CINR. Let C be the received authentic signal power for a particular satellite-and-signal combination [e.g., the GPS L1 C/A signal corresponding to pseudo-random number (PRN) code 4],  be the (approximately flat) receiver thermal noise power density near the frequency band of interest, and
  be the spectrally-flat-equivalent interference noise power density. Then CINR is defined as
With predictable variations due to antenna gain pattern and spreading loss removed, “a hypothesis test for interference can be formulated in terms of the common decrease in a vector of CINR measurements for a particular frequency band due to an increase in . For a typical LEO receiver, the minimum detectable terrestrial source EIRP is 3.5 dBW.
RECEIVED POWER MONITORING. Received power monitoring for interference detection is in principle no more sensitive than CINR monitoring but avoids the requirement to assemble a vector of measurements only from authentic GNSS signals, which can be difficult under spoofing interference. In fact, received power monitoring requires no tracking of signals at all.
SIGNAL ACQUISITION. A potent type of GNSS interference, called matchedspectrum interference, allocates its signal power to match the spectrum of a target authentic GNSS signal, thus maximizing
for a receiver tracking that signal. When a matched-spectrum interferer employs a standard GNSS spreading code to achieve the requisite spectrum-matching, it becomes a matched-code interferer, which is extremely effective at denying GNSS service to surrounding receivers at cold-start. However, matched-code interference is itself vulnerable to high-sensitivity detection because a distant receiver can acquire the interference signal just as it does an authentic GNSS signal. Moreover, a receiver in LEO can de-spread the matched-code interference with the known spreading code, thus extracting a pure carrier tone from whose Doppler time history the source may be geolocated, an example of which will be provided later on.
Consider the sensitivity of matchedcode interference detection via signal acquisition from LEO. Denote the LEO receiver’s acquisition threshold by  dB-Hz. Detection via acquisition is possible when
 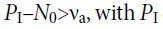 expressed in
  204 dBW/Hz, a receiver antenna gain of 3dB, an L1 spreading loss of 148.5 dB, and conservatively supposing 30 dH-Hz, the minimum detectable EIRP of a terrestrial interference source is approximately PEIRP=–28.5 dBW. Thus, detection of matched-code interference by signal acquisition is more than 1000 times more sensitive than detection of unpredictable wideband interference via monitoring or received power monitoring.
Detection Frequency
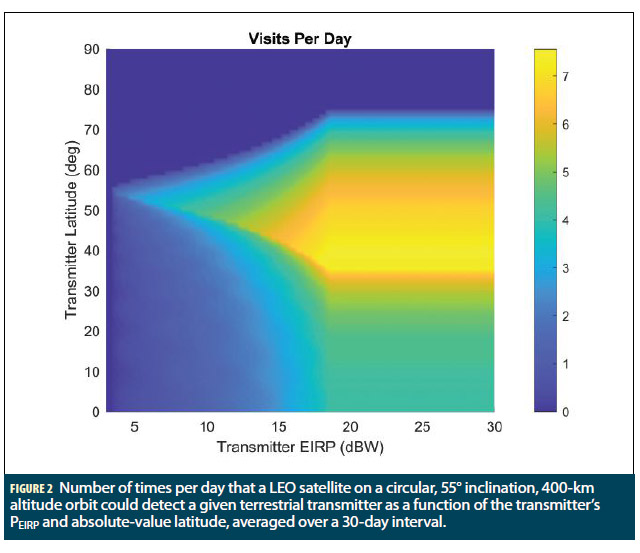
A terrestrial interference source is potentially detectable by LEO satellite monitoring several times a day.Consider a LEO satellite in a near-ISS orbit: circular, 400-km altitude, and 55° inclination. Assuming CINR-based detection with a false alarm probability of  , Figure 2 shows the average number of times per day that such a satellite could detect an interference source as a function of
  and latitude. Sources with =3.5 dBW are detectable only when the satellite’s ground track crosses directly through the source’s location. As PEIRP rises, detection becomes possible even as the satellite ground track passes ever further from the source, leading to a higher frequency of detections. This behavior saturates for ≥17 dB, yielding a minimum of 3 detections per day for all latitudes within 75° of the equator.
Besides the average detection frequency shown in Fig. 2, it is instructive to consider the maximum time between detections for a given PEIRP. Analysis of the ground-track lattice formed by a LEO satellite with the above orbital parameters reveals that the lattice is sufficiently dense to guarantee detection of transmitters with >6.1 dBW every 4 days, and detection of transmitters with >3.65 dBW every 17 days, for all latitudes within 55° of the equator.

Geolocation Accuracy
Assuming a carrier can be extracted from an interference signal, single-satellite- based transmitter geolocation is possible from Doppler measurements alone, with accuracy depending on the transmitter clock stability. For a single LEO overflight of an interference source driven by a low-quality clock (e.g., a TCXO), 95% positioning accuracy better than 78 km is possible. If the transmitter clock is of higher quality (e.g., an OCXO), the 95% accuracy is better than 1 km. By combining solutions from multiple overflights, 95% accuracy can be better than 2 km for a TCXO and 100 meters for an OCXO.
Interference from Syria
Analysis of an interference source active on the east coast of the Mediterranean illustrates the techniques that can be applied generally to study GNSS interference sources from LEO.
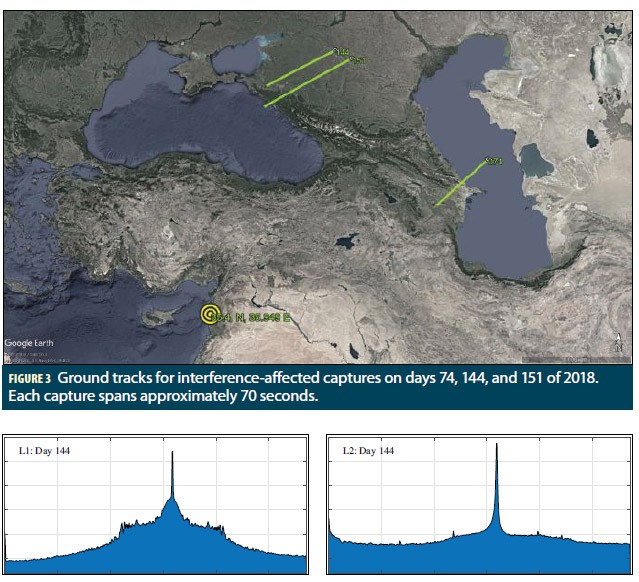
Ground processing of FOTON’s raw IF samples using The University of Texas’s latest software-defined GNSS receiver enabled analysis and tracking of all radio frequency signals near GPS L1 and L2. Particularly strong interference signals captured on three days in the first half of 2018 along the ground tracks shown in Figure 3 exhibited the following characteristics:
- False GPS L1 C/A signals with spreading codes from 1 to 32 were present in the data.
- All false signals spread by the GPS L1 C/A spreading codes exhibited a nearly common and constant carrier frequency near GPS L1.
- No discernible navigation data were modulated on the false GPS L1 signals, rendering them ineffective at spoofing, but particularly effective at denying GPS service (jamming).
- No false Galileo E1 signals were detected.
- Civil GPS signals at L2 were subject to narrowband interference but were not spoofed as on L1.
- The false signals at L1 exhibited unexplained fading and spectral characteristics.
- The interference at L1 caused approximately 6 dB of C/N0 degradation of authentic GNSS signals for a narrowband (~3 MHz) receiver at a distance of 1340 km.
Figures 4, 5 and 7 illustrate spectral characteristics and Doppler history for interference captured on day 144 of 2018.
Transmitter EIRP
The drop in CINR observed at the ISS when 1340 km from the source was approximately 6 dB. Assuming that the interference acts as multi-access interference, whose spectral density is 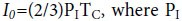 is the received interference power and
  =1/1023 ms is the GPS L1 C/A spreading code chip interval, and assuming =–204 dBW/Hz, a CINR drop by 6dB implies
  PI=–137.4 dBW. Removing the 3 dB added by the received antenna, the total interference power impingent on a 0 dBi antenna at the location of the ISS would be approximately –140 dBW.
The spreading loss at L1 for a distance of 1340 km is 159 dB. Thus, the EIRP of the interference source is 140+159 ≈ 20 dB, which implies a 100-W transmitter.
Source Localization
Analysis of raw IF data captured on days 74, 144, and 151 of 2018 revealed strong GNSS interference sources in both GPS L1 and L2 frequencies. GPS L1 contained structured interference bearing a carrier (nominally centered at GPS L1), GPS L1 C/A spreading code, and no apparent BPSK symbols. The absence of BPSK symbols on these PRN channels of structured interference provided a convenient and effective method to distinguish between authentic and spoofed signals. Each interference channel was observed to be aligned with respect to spreading code start time. While some authentic GPS L1 C/A signals were effectively jammed, the majority of authentic signals were still trackable owing to sufficient spreading code start time misalignment at the receiver. Additionally, other constellations and signal types were unaffected by this interference source. Thus, a receiver navigation solution could still be formed despite GPS L1 and L2 interference.
A receiver navigation solution was first estimated on days 74, 144, and 151 of 2018 using an extended Kalman filter with pseudorange and carrier-derived Doppler measurements. A nearly-constant acceleration dynamics model was used to propagate the receiver state estimate between measurement updates. With these time histories of receiver state treated as fixed priors, a batch estimator for interference source position and clock bias was then formulated using observed interference Doppler as measurements. It was assumed that the interference source observed on all three days originated from the same transmitter and that the transmitter was stationary. These assumptions allowed multiple days of Doppler measurements, collected on non-repeating ground-tracks, to be combined to form an observable and better constrained estimate. If these assumptions were untrue, they could be expected to manifest in post-fit measurement residuals. Consistent with the assumption of a stationary transmitter, transmitter altitude was assumed to be near ground-level and was included as a pseudo-measurement. Additionally, a quasi-constant transmitter frequency was assumed during each capture. Comparing transmitter frequency estimates between captures revealed nearly identical values; this provided evidence to support the assumption that the same transmitter was being observed. Transmitter frequency was also evaluated with a quasi-constant ramp model, but the quasi-constant frequency model was concluded to be sufficient. Figure 7 shows time histories of Doppler and postfit residuals for false PRN 10 collected on day 144. The standard deviation of post-fit residuals is 2.3 Hz. Figure 8 shows the estimated position of a single interference source, whose location, determined to better than 220 meters (95%), coincides with an airbase in Syria.
Implications for Civil GNSS
Assuming standard free-space path loss and a uniform transmitter antenna pattern, for a commercial airliner passing near the transmitter at an altitude of 10 km, the received power into a 0 dBi antenna would be -86 dBW, assuming the interference signals are attenuated by 10 dB due to the aircraft’s fuselage. This would imply an interference-to- authentic signal power ratio of 49 dB, which would cause a drop in C/N0 of approximately 39 dB, enough to deny GNSS service to the aircraft.
Global Interference Survey
While the raw IF data captures from the ISS FOTON receiver enable detailed monitoring of GNSS interference signals and their structure, such captures are limited to short durations and have limited availability. In contrast, the 1-Hz standard GNSS observables and 100- Hz data-wiped complex IQ correlation products have been logged nearly continuously over the last two years. These data facilitate a worldwide analysis of strong GPS interference and provide insight into the persistent/intermittent nature of interference sources.
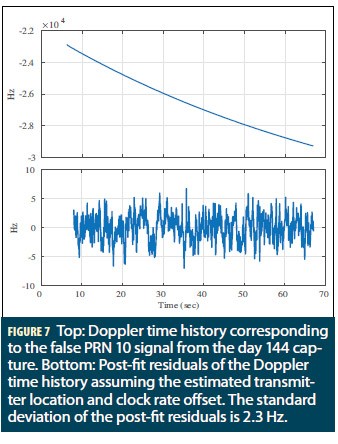
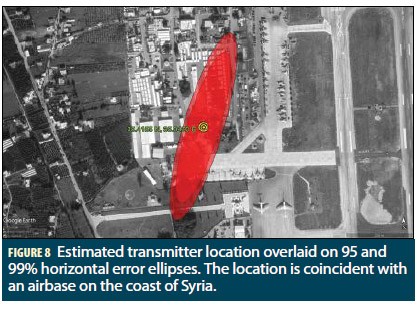
Figure 10 shows the ratio of number of potential interference events recorded at GPS L1 frequency to the total number of hypothesis tests performed at each location for the detection threshold mentioned above. As expected, a high ratio of potential interference events is reported to the east of the geolocated GPS interference source in Syria (marked as the red dot in Figure 10). The high value of the statistic suggests that the interference activity in Syria was relatively persistent over the time of data recording on the ISS.
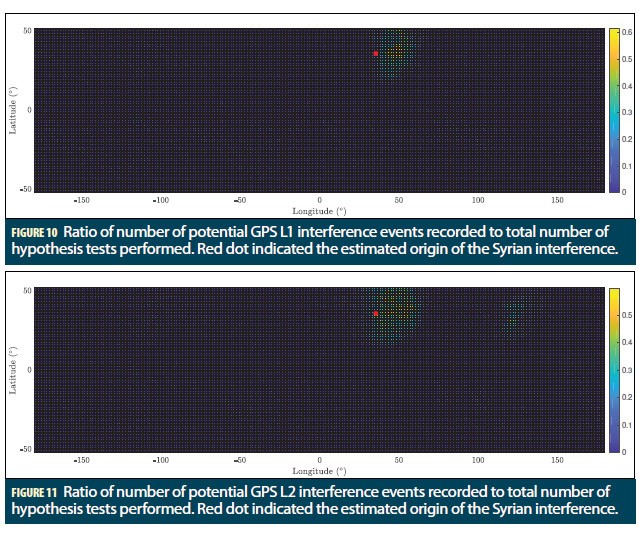
Figure 11 shows the same ratio at GPS L2 frequency. In addition to the expected interference over Syria, Figure 11 suggests strong ongoing GPS L2 interference over mainland China.
This method of counting potential interference events based on C/N0 degradation ignores cases where interference might lead to complete loss of track of some or all GPS signals. However, the data from the ISS shows that FOTON does not lose track of GPS signals even when flying by the strong interference source in Syria. In fact, the reported CINR over Syria is well above the weakest signal that FOTON is capable of tracking. As a result, it was concluded that in cases where FOTON seems to track few or no GPS signals, it is likely due to some abnormal behavior of the receiver, and not due to a potential interference event.
In addition to the global average analysis summarized in Figures 10 and 11, it is instructive to examine the time history of receiver reported CINR as a function of time when the ISS flies by the interference hot spots mentioned above. Figure 12 shows two segments of such time histories for signals within the admissible receiver off-boresight window as the ISS goes over the strong interference regions in Syria (Fig. 12(a)) and China (Fig. 12(b)). Green and blue data points represent interference-free L1 and L2 frequency signals, respectively, while red data points represent epochs at which the receiver is reported to be under interference. Both GPS L1 and L2 are declared under interference in Fig. 12(a) where the ISS flies over the Syria, while only GPS L2 is declared under interference in Fig. 12(b). The brief dip in C/N0 in Fig. 12(b) prior to the major dip over mainland China is in fact caused by the Syrian interference. Gaps in the time histories indicate period with no tracked signals in the admissible off-boresight window.

One might be skeptical about categorizing such drops in reported CINR to be potential interference events, while complete tracking failure events had earlier been attributed to abnormal FOTON behavior. However, during the above drops in reported CINR, it was observed that the carrier-phase measurements generated by FOTON were relatively clean. Carrier-phase is the most sensitive measurement made by the FOTON receiver and is expected to fall apart earliest in case of any malfunction of the FOTON receiver. As a result, it is believed that such drop in CINR for all tracked signals is most likely explained by intentional/ unintentional GPS interference.
Conclusions
Low-Earth-orbiting instruments capable of receiving signals in GNSS bands are a powerful tool for characterizing GNSS interference emanating from terrestrial sources. Data from one such instrument, the FOTON software-defined GNSS receiver, operational on the ISS since February 2017, reveal interesting patterns of GNSS interference. A particularly powerful and constant interference source was active in Syria during 2017 and 2018. Its 100-W (EIRP) transmissions at the GPS L1 frequency contain signals modulated by all 32 GPS L1 C/A spreading codes, but with no data modulation, indicating that the signals’ purpose is denial of GNSS service. Via Doppler positioning, the Syrian transmitter was located to within 220 meters, an achievement without precedent in the open literature. A global analysis of carrier-to-noise-density ratio measurements also revealed persistent interference in mainland China.
Acknowledgment
Work at the University of Texas has been supported by the National Science Foundation under Grant No. 1454474 (CAREER). Work at the Naval Research Laboratory was supported by the Chief of Naval Research. The STP-H5/ GROUP-C experiment was integrated and flown under the direction of the Department of Defense Space Test Program.
This article is based on a paper presented at ION GNSS+ 2019.
Authors