 Figures 3 & 4
Motivation and Background
Motivation and Background
GNSS technology has become a crucial component for modern society. One of the major factors that impacts the performance of GNSS at high latitudes and equatorial areas is ionospheric scintillation. Ionospheric scintillation is usually manifested by rapid and random fluctuations in signal amplitude and carrier phase (see S. Basu et alia (2002) and Y. Jiao and Y.T. Morton (2015) in Additional Resources near the end of this article). During severe ionospheric scintillation, deep amplitude fading and high carrier dynamics may result in increased carrier tracking loop errors, carrier phase cycle slips, and potential loss of lock of signals. (see S. Skone et alia (2001) and J. Seo et alia (2011), Additional Resources). As a result, there is a need to monitor and detect ionospheric scintillation, to gain an understanding of the signal characteristics during scintillation, and to develop robust receiver algorithms that can mitigate scintillation effects.
The motivation for this project was initiated by the need to effectively and efficiently collect sufficient volume of high quality, real scintillation data for the purpose of analyzing and characterizing the ionospheric scintillation phenomena. Since 2011, the authors’ research group has been developing multi-GNSS data collection systems to capture scintillation signals by deploying these systems at various locations known to be susceptible to scintillation activities around the world (see Y. Morton et alia (2015)). Figure 1 (see figure at the top of this article) shows the locations of the established and planned data collection sites. Some of the data collection systems are equipped with devices to collect raw intermediate-frequency (IF) samples during scintillation for post-processing. This capability is especially important when commercial ionospheric scintillation monitoring (ISM) receivers are unable to maintain lock of the signals or are incorrectly estimating signal parameters during strong scintillation. A caveat of IF data collection is that it requires an enormous storage space due to the high sampling rate. Therefore, an effective scintillation detector is needed to automatically and accurately detect scintillation events and trigger the IF data collection process. The detector is also useful for researchers to sort out scintillation events collected by continuously operating ISM receivers for analysis.
Most previous scintillation monitoring and detection methods were based on commonly used indicators such as the amplitude and carrier phase scintillation indices (e.g. S4 and σϕ), and their probability density functions (PDFs) (see W. Fu et alia (1999), S. Taylor et alia (2012) and D.V. Ratnam et alia (2015), Additional Resources). These indicators are the so-called lower-order moments of the scintillation statistics derived from standard deviations of signal parameters around their nominal trends. Abnormalities in these lower-order moments due to scintillation are often indistinguishable from other effects such as multipath and interference. In addition, these previous scintillation detection methods are usually based on traditional Neyman-Pearson detection theory (S.M. Kay (1998), Additional Resources) in which certain PDFs (e.g. Gaussian) under different hypotheses have to be assumed before training and detection. For these reasons, it is difficult for these previous detectors to have reasonable false alarm rates and missed event detection rates.
While missing event detection will clearly lead to missed opportunities to study potential interesting cases, a high false alarm rate will result in the data collection system capturing events that are not of interest to the researcher and lead to wasted storage space and analysis time.
To overcome the above problems, we have developed a new automatic scintillation detection technique using a machine learning algorithm, called support vector machine (SVM) (see articles from Y. Jiao et alia (2017, 2016 and 2017), Additional Resources). The SVM algorithm is based on the Structural Risk Minimization (SRM) principle, which seeks the boundary with the greatest separation of the two classes in the data samples (see S. Haykin, (2009), Additional Resources). The data samples are transformed into high-dimensional space, where the data will reveal features that could not be captured by lower-order moments of the signal statistics. Moreover, unlike algorithms based on the traditional Empirical Risk Minimization (ERM) (e.g. minimum square error, least squares, and least mean squares), which uses empirical PDFs of the signals to minimize the error between the desired output and the actual output (see again S. Haykin, (2009), the SVM algorithm does not have to assume the PDFs for signals under different hypotheses. Finally, the SVM algorithm can further transfer the data samples that are not originally linearly separable into even higher dimensional space where they may be linearly separable.
The basic concept of SVM is shown in Figure 2 (see figure at the top of this article). Given a training data set
{xp; dp}Pp=1
where xp ∈ ℝN is the pth input sample, dp = ±1 represents the desired label for two classes. If the classes are linearly separable in ℝN, then the discriminant function g(x) = wTx + b exists such that
xp ∈ C1 → g(xp) ≥ 1, then dp = +1 (1)
xp ∈ C0 → g(xp) ≤ 1, then dp = −1 (2)
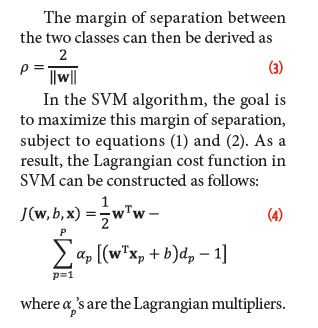
The margin of separation between the two classes can then be derived as
Equation (3) (See inset photo, above right, for equations 3 & 4)
In the SVM algorithm, the goal is to maximize this margin of separation, subject to equations (1) and (2). As a result, the Lagrangian cost function in SVM can be constructed as follows:
Equation (4)
where αp’s are the Lagrangian multipliers.
The further development of SVM techniques is mainly established on the solution of equation (4). For detailed mathematical descriptions and derivations, the readers are referred to Y. Jiao et alia (2017) and S. Haykin, (2009).
In this article, we summarize the findings reported in Y. Jiao et alia (2017, 2016 and 2017), Additional Resources, which used a large volume of real scintillation data collected from stations in the northern auroral and equatorial areas to train and test the SVM-based amplitude and phase scintillation detectors. The performance of the detectors will be mainly reviewed, including validation accuracy, testing performance on novel data, and concurrent amplitude and phase scintillation detection performance using similar SVM techniques using data from equatorial regions.
Training and Validation
All the training data was collected by commercial ISM receivers, which output 50 hertz signal intensity and 100 hertz phase measurements. Only GPS L1C/A data is used in this article with an elevation mask of 30˚ to reduce multipath effect. For amplitude scintillation detection, a total of 46 hours of data consisting of 15 segments from Ascension Island and Hong Kong are selected for training. For phase scintillation detection, a total of 28 hours of data consisting of 30 segments from Gakona, Alaska are used for training (Figure 3). The training data are partitioned into three-minute blocks. Empirical class labels are assigned to the training data based on manual inspection of the values of amplitude scintillation index S4 and phase scintillation index σϕ within each block (examples shown in Fig. 2). Only two class labels are assigned: 0 for non-scintillation data, and 1 for scintillation data. More detailed information of the training data set is listed in Y. Jiao et alia (2016 and 2017), Additional Resources.
The content of the training vector for a three-minute data block is listed in Table 1. The first entry in a column training vector is the class label assigned manually. The second and third entries are the maximum and the average S4/σϕ index values within the block. To test the impact of the index values on the performance of the SVM detectors, the second and third entries can be turned on or off in the training. The rest of the entries in the training vector are power spectrum densities (PSD) for different frequencies obtained from performing short-time Fourier Transform (STFT) on raw signal intensity and detrended phase measurements for amplitude and phase scintillation detection, respectively.
Validation can be performed using the training data and the manually-assigned class labels. The validation methods used for amplitude and phase scintillation detection are 25% hold-out validation and 5-fold cross-validation, respectively, as described by S. Haykin, (2009). In 25% hold-out validation, 75% of the training data is selected randomly to train the detector, while the rest is reserved for validation. In 5-fold cross-validation, the training data is randomly portioned into five subsets of equal sizes. One out of the five subsets is retained as the validation data to test the model that is trained by the remaining four subsets. Then, this cross-validation process is repeated five times, so that each of the subsets is used exactly once as the validation data set. The final validation performance is an average of the five validation results. The latter validation method is more suitable for a small training data set.
The performance of the amplitude and phase scintillation detectors is evaluated in terms of the overall accuracy, and the true positive rate (TPR) and the false positive rate (FPR) of the operating point as listed in Table 2. TPR and FPR are also commonly referred to as “hit rate” and “false alarm rate”, respectively.
They describe the probability of categorizing a target (e.g., a scintillation event) as present when it is truly present or truly absent. In general, the higher the TPR or the lower the FPR is, the better the performance of the detector is. In this study, there are four variations of the detector implementation: the S/σ4ϕ features (2nd and 3rd entries) are either included or excluded in the training vectors; and the SVM algorithm is either linear SVM or medium Gaussian kernel SVM with a kernel scale of 9.1.
Table 2 shows that both the SVM amplitude detector and phase detector have good performances. Compared to the phase scintillation detector, the general performance of the amplitude scintillation detector seems to be slightly better with a higher overall accuracy and lower FPR. The four variations of either detector show comparable performance. This indicates that non-scintillation and scintillation events are almost linearly separable in the high-dimensional space, and excluding index features from the training vectors does not influence the validation performance of the amplitude or phase scintillation detector.
Test Performance on Novel Data
To test the generalization capability of the SVM scintillation detectors, several segments of novel data from the training data sites and from other data sites are used. Figure 4 and Figure 5 show test results of the SVM amplitude and phase scintillation detectors using novel data from the training data sites (subplots (a)) and sites not involved in training (subplots (b)). Only the linear SVM technique is used for testing as it shows similar performance to the medium Gaussian SVM in the validation, and is easier to implement.
Results in Figure 4 and Figure 5 show that all the SVM detectors are able to capture strong scintillation events. However, for phase scintillation detection, the SVM detector trained with σϕ features show obvious miss-detection of medium to weak scintillation events, while the detector trained without σϕ features seem to have no problem in detecting weak to strong scintillation. This phenomenon shows that the absolute values of S4 and σϕ indices alone are not reliable indicators of scintillation activity. For phase scintillation, higher dimension features such as the spectral contents may offer a more reliable means to distinguish scintillation from other activities that impact phase measurements. This is the main reason why a machining learning-based approach that exploits the high-dimensional features can outperform traditional Neyman-Pearson detectors which are solely based on assumed models of low-order statistics such as scintillation indices.
In addition, Figure 4 and Figure 5 demonstrate that the linear SVM detectors trained without S4/σϕ features have good generalization capabilities, as they are effective on novel data taken at different locations from the training data sites.
Concurrent Phase and Amplitude Scintillation Detection at Low Latitudes
Other than the stand-alone performance of the amplitude and phase scintillation detectors, it is also interesting to investigate the relationships in SVM detector performances for both amplitude and phase scintillation on the same data set from low latitude areas, where the strongest scintillation events tend to occur. Unlike high-latitude scintillation, which is dominated by phase scintillation, scintillation observed in the low-latitude area often features concurrent amplitude fading and rapid phase fluctuations (see articles from Y. Jiao et alia (2015 and 2013), Additional Resources). Using the data from low-latitude stations, we are able to investigate this feature of low-latitude scintillation from the perspective of detection performance. To ensure that we make a reasonable comparison, the linear SVM detectors trained without S4/σϕ features are used for amplitude scintillation detection and phase scintillation detection, respectively.
Figure 6 shows results for concurrent amplitude and phase scintillation detection using SVM on novel data from Hong Kong, Jicamarca (Peru), and Singapore. The results show that the SVM phase scintillation detector trained with data from Gakona, AK can effectively operate on data from the low-latitude area. This indicates that the higher dimensional features in phase scintillation are similar in high and low latitude events.
Based on visual inspection of the values of S4 and σϕ indices in Figure 6, the two indices are highly correlated at low latitudes. However, amplitude scintillation and phase scintillation detections are not concurrent. Results show that amplitude scintillation appears to be detected more often than phase scintillation.
To further quantify the relationship between concurrent amplitude and phase scintillation detection, Figure 7a plots the percentage of positive phase scintillation detection during positive amplitude scintillation, with respect to different amplitude scintillation levels represented by the mean S4 values within its three-minute block. The data used for these statistics are 15 segments of novel data with total length of 53 hours from Hong Kong, Jicamarca, and Singapore. Figure 7a shows that the percentage of phase scintillation detection increases as the amplitude scintillation level becomes stronger. When the average S4 index within a block exceeds 0.3, a concurrent phase scintillation event will definitely be detected if an amplitude scintillation event is detected. A reverse study has also been conducted and the results are shown in Figure 7b where a positive phase scintillation detection is nearly always accompanied by a positive amplitude scintillation detection.
The above relationships indicate that at low latitudes, an amplitude scintillation detector alone is sufficient to detect scintillation activities. Low level amplitude scintillation may not be accompanied by noticeable phase scintillation. However, all phase scintillations are associated with amplitude scintillations. This observation is important for low-latitude scintillation monitoring because signal intensity measurements are more reliable than phase measurements at low latitudes. For high latitudes, phase scintillation detector is needed because phase scintillation is the dominating activity as described by Y. Jiao and Y.T. Morton (2015).
Summary and Conclusions
This article introduces a SVM-based machine learning algorithm for autonomous ionospheric amplitude and phase scintillation detection on GPS signals. The input of the detectors is the PSD of the raw signal intensity and the detrended phase measurements. Instead of having to acquire knowledge of the PDFs of the signals, the machine learning algorithm learns the different high-dimensional features for non-scintillation and scintillation events from the training data, and automatically generates a discriminative hyperplane to optimally separate the two classes with the maximum separation space.
The trained SVM amplitude and phase scintillation detectors were evaluated in validation and testing, which demonstrate good validation performance and generalization capability in testing. A summary of the findings and conclusions in this work is recapitulated below:
- The overall accuracies in the validation are around 98% and 92% for the SVM amplitude scintillation detector and phase scintillation detector, respectively.
- Linear and medium Gaussian kernel SVM perform similarly for scintillation detection.
- Excluding S4/σϕ features in the training vector does not affect the validation performance.
- Testing on novel data reveals miss-detection of weak to moderate phase scintillation events using the SVM phase detector trained with σϕ features. This result shows that phase scintillation index values may not be a good indicator of the scintillation activity. Future development of the phase scintillation detector should mainly be based on features in the frequency domain, instead of the absolute values of phase fluctuations.
- The SVM detectors can be expanded to work for data from other sites not involved in training.
- The detection of amplitude and phase scintillation may not be simultaneous with similarly implemented SVM detection techniques. At low latitudes, whenever phase scintillation is detected, it is almost certain that amplitude scintillation will be detected at the same time. On the other hand, when amplitude scintillation is detected, phase scintillation may not be simultaneously detected but the likelihood increases as scintillation intensifies.
Acknowledgement
The data collection systems are developed, assembled, and managed by CSU GPS Lab engineers Steve Taylor and Harrison Bourne. The authors wish to thank Dr. Don Hampton at the University Alaska Fairbanks, Mr. Marty Karjala at HAARP, Mr. Kevin Abnett at Poker Flat Research Range, Dr. Ding Yu Heh at the Nanyang Technological University, Dr. Marco Milla at the Jicamarca Radio Observatory, and Dr. Zhizhao Liu at the Hong Kong Polytechnic University for their support and hosting of the GNSS data collection systems. Dr. Todd Pedersen from Air Force Research Laboratory at Kirkland AFB helped to collect the GNSS scintillation data on Ascension Island. Jicamarca Radio Observatory is a facility of the Instituto Geofisico del Peru operated with support from NSF grant AGS-0905448 through Cornell University. Ms. Yu Jiao’s work is funded through a startup grant from Colorado State University and a grant from AFOSR (FA9550-14-1-0265). The data collection systems were deployed with funding support from AFRL (FA8650-08-D-1451), AFOSR (FA9550-10-1-0346), the Consortium of Ohio Universities on Navigation and Timekeeping (COUNT), and NSF (AGS-1428042).
Note: The methodologies and results presented in this article are based on materials presented in articles by Y. Jiao et alia (2017, 2016 and 2017), Additional Resources.
Additional Resources
[1] S. Basu, K.M. Groves, S. Basu and P. Sultana, “Specification and forcasting of scintillations in communication and navigation links: current status and future plans,” J. Atmo. Solar-Terr. Phy., vol. 64, no. 16, pp. 1745-1754, Nov. 2002.
[2] S. Haykin, Neural networks and learning machines, 3rd ed., Upper Saddle River, NJ: Pearson Education Inc., 2009
[3] W. Fu, S. Han, C. Rizos, M. Knight and A. Finn, “Real-time ionospheric scintillation monitoring,” in Proc. ION GPS, Nashville, TN, 1999.
[4] Y. Jiao and Y.T. Morton, “Comparison of the effect of high-latitude and equatorial ionospheric scintilltaion on GPS signals during the maximum of solar cycle 24,” Radio Sci., vol. 50, no. 9, pp. 886-903, Sept. 2015.
[5] Y. Jiao, J.J. Hall and Y.T. Morton, “Automatic equatorial GPS amplitude scintillation detection using machine learning,” IEEE Trans. Trans. Aerosp. Electron. Syst., 2017.
[6] Y. Jiao, J.J. Hall and Y.T. Morton, “Performance evaluations of an equatorial GPS amplitude scintillation detector using a machine learning algorithm,” in Proc. ION GNSS+ 2016, Portland, OR, 2016.
[7] Y. Jiao, J. J. Hall and Y.T. Morton, “Performance evaluation of an automatic GPS ionospheric phase scintillation detector using a machine learning algorithm,” NAVIGATION, Journal of the Institute of Navigation, 2017.
[8] Y. Jiao, Y.T. Morton, S. Taylor and W. Pelgrum, “Characterization of high latitude ionospheric scintillation of GPS signals,” Radio Sci., vol. 48, no. 6, pp. 698-708, Dec. 2013.
[9] S.M. Kay, Fundamentals of statistical signal processing: Detection theory, vol. 2, Upper Saddle River, NJ: Prentice-Hall, 1998.
[10] Y. Morton, Y. Jiao and S. Taylor, “High-latitude and equatorial ionospheric scintillation based on an event-driven multi-GNSS data collection system,” in Proc. Ionospheric Effects Sym., Alexandria, VA, 2015
[11] D.V. Ratnam, G. Sivavaraprasad and J. Lee, “Automatic ionospheric scintillation detector for global navigation satellite system receivers,” IET Radar Sonar Navig., vol. 9, no. 6, pp. 702-711, 2015.
[12] J. Seo, T. Walter and P. Enge, “Availability impact on GPS aviation due to strong ionospheric scintillation,” IEEE Trans. Aerosp. Electron. Syst., vol. 47, no. 3, pp. 1963-1973, 2011.
[13] S. Skone, K. Knudsen and M. de Jong, “Limitations of GPS receiver tracking performance under ionospheric scintillation conditions,” Phys. Chem. Earth (A), vol. 26, no. 6-8, pp. 613-621, 2001.
[14] S. Taylor, Y. Morton, Y. Jiao, J. Triplett and W. Pelgrum, “An improved ionosphere scintillation event detection and automatic trigger for GNSS data collection systems,” in Proc. ION ITM, Newport Beach, CA, 2012.


