
This study examines the frequency, type and severity of interference events at specific locations in the country, providing valuable insights into the use of detectors, the nature of interference encountered, their potential sources and the impact on GNSS-derived positions.
ANURAG RAGHUVANSHI, SUNIL BISNATH YORK UNIVERSITY, CANADA, JASON BOND CANADIAN POSITIONING, NAVIGATION AND TIMING OFFICE
GNSS signals are weak when they reach Earth, making them susceptible to intentional radio frequency interference (RFI) in its most severe form: jamming [1]. As in many countries, using radiocommunication jamming devices in Canada is prohibited. These devices negatively impact critical infrastructure, interfering, disrupting or entirely blocking the GNSS signals they depend on for PNT information. Despite their prohibition, GNSS jammer devices are still sold through online vendors, with several cases of illegal importation, possession and use encountered in Canada. The Canadian public is largely unaware of the harmful risks jammers pose to PNT-reliant users.
The frequency, severity and sources of GNSS RFI events in Canada have not been commonly studied. To evaluate this problem, several federal Canadian departments and agencies, including Innovation, Science and Economic Development Canada (ISED), the Department of Fisheries and Oceans (DFO), Natural Resources Canada (NRCan) and NAV CANADA, conducted a collaboration to collect and assess GNSS RFI data at a number of sites across the country. Expertise from York University’s Department of Earth and Space Science and Engineering was leveraged to analyze the data.
Three types of commercial-off-the-shelf GNSS RFI detectors were purchased and deployed in three Canadian cities for approximately one year. Four Talen-X Broadsense devices, two Spirent GSS200D detectors and one NovAtel PwrPak 7 GNSS receiver with Interference Toolkit were deployed in Vancouver, Montréal and Ottawa. Devices were collocated at some sites to allow for results comparison. Because interference detection outputs from each device are non-standardized, customized data analyses were required. For this study, a preliminary data analysis focused on the data collected at the Montréal site where a Talen-X Broadsense and a Spirent GSS200D were situated.
The goal of the study is to provide insight for federal organizations, other levels of government and non-government partners within critical infrastructure sectors regarding the following aspects of GNSS RFI in Canada:
• Frequency: Encompasses the number of events on a day-to-day basis along with the GNSS band affected by the event;
• Type of interference: Classification of the interferer (wideband, narrowband, chirp, etc.) causing the event; and
• Severity of event and its impact: The impact of interference on receiver statistics such as carrier-to-noise density ratio (C/N0), number of satellites tracked, receiver noise, etc. The impact on accuracy provided by the receiver and potential cause of degradation (loss of lock, cycle slips, etc.) is also analyzed.
Other Studies
Recent, notable endeavors focused on monitoring and analyzing GNSS disruptions arising from GNSS RFI include [2-6] . [2] used a combination of Power Spectral Density (PSD), received power and C/N0 to detect and flag interference events. [4] leveraged two detectors using received power and mean C/N0 and detected around 50 interference events at three Swedish Continuously Operating Reference Stations (CORS). [5] analyzed data from Norwegian highways and detected interference events using receiver Automatic Gain Control (AGC) and C/N0. [6] also used C/N0 and time-differenced C/N0 to monitor interference events on U.S. national highways. From the previous research, C/N0 and AGC are good candidates for interference detection and can be used to flag events [7]. In the current work, receiver-based parameters such as number of satellites being tracked, receiver noise and accuracy are also analyzed to see the effect interference has on receiver functioning. The primary aim of this analysis is to suggest a parameter or set of parameters to authorities that can be used to automatically detect and flag events. In the current setup, government researchers must investigate large amounts of data to identify events.
In [8,9], various detection techniques are referenced, including the use of software defined radios (SDR) [10,11] and frequency domain analysis for classification of interferers, as presented in [12,13]. This article also employs a similar approach for interference detection and classification, using the Spirent detector. However, more Spirent detector testing is being done and updates will be provided in future articles. A key focus of this work is to present the results obtained using these techniques.
The impact of interference on GNSS receivers has been extensively studied in [14-20]. In the current study, the impact of interference on GNSS observables and position accuracy was analyzed. Detecting interference is crucial, as it is equally important to assess its effect on receiver performance. By examining the behavior of receivers generated
observables, authorities can test techniques in the future to effectively mitigate the effects of interference.
The present article aims to further understand GNSS vulnerability, with a specific focus on Canada. To ensure robust detection, the analysis in this study incorporates collocated commercial off-the-shelf (COTS) detectors, which enhance the overall reliability of the detection process. Moreover, the current research provides a comprehensive
examination on the impact of interference on GNSS receiver functionality. This work not only encompasses interference detection and classification, but also delves into the subsequent effects on GNSS receiver performance.
Methodology
This section provides detailed information regarding the data collected at the Montréal site, including the dates of data collection and the detectors used. The detectors employed in this study generate multiple parameters, each offering valuable insights. Within this section, a concise overview of the specific parameters selected for analysis is provided. Furthermore, the section concludes by offering a comprehensive explanation of the approach used to analyze the collected data. In the future, it is desired to devote further analysis efforts to the other two sites where data was collected for this campaign.
Description of Datasets
In the current study, data from two collocated GNSS interference detectors in Montréal are analyzed. The receivers are installed at a site in the vicinity of a highway and local roads. Table 1 provides specific details of data collection at the Montréal site.
Spirent Datasets
The Spirent detector monitors GPS L1 and GPS L5 frequencies and stores raw data when an event is detected. It uses a pre- and post-correlation technique to detect interference. Pre-correlation is dependent on the digital signals at baseband or intermediate frequency. Post-correlation uses information such as signal-to-noise ratio, automatic gain control, number of satellites tracked and elevation and azimuth of the satellites to register an event. The event’s raw data are then uploaded on a server, which uses Spirent classification techniques to generate details of the event, such as type of interference, priority of the event, and power of the interferer as shown in Table 2.
In the current study, the Spirent detector data are accessed through a web interface. Details of events are downloaded as a .csv file and files are used for further investigation. Each .csv file has details such as priority of event, frequency affected, power, class, and duration of interference.
Talen-X (Broadsense) Datasets
The Broadsense Micro (BSµ) detector from Talen-X (now Safran) is comprised of two Neo-M8 uBlox GNSS receivers. The receiver tracks GPS and GLONASS signals in the L1 band. The receiver provides several receiver observables that are relevant for interference analysis such as number of satellites tracked, receiver noise, carrier-to-noise density ratio (C/N0), and automatic gain control (AGC). The receiver has a proprietary jamming detection algorithm, and the detection flag is reflected by a parameter called “jamming penalty.” Higher jamming penalty values indicate more significant interference. This detector generates a set of 11 .csv files, each providing specific information.
Data Analysis Parameters
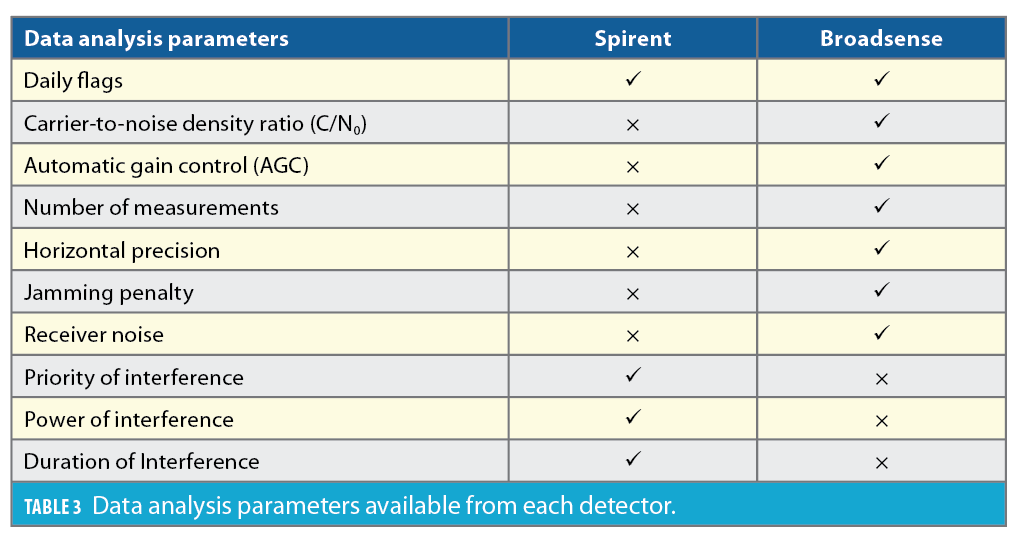
The two detectors provide different information. The Broadsense detector provides receiver-based information such as number of measurements, C/N0, AGC, receiver noise in addition to interference-based information such as jamming penalty. The Spirent only provides interference relevant information such as priority, power and duration of interference. A detailed description of analysis parameters can be found in [3]. Table 3 provides an overview of parameters available from each detector.
Data Analysis Approach
Data from Spirent and Broadsense devices can analyze interference frequency by estimating daily event flags for each site, achieving the study’s first goal. In the Spirent device, the number of events is calculated by the number of events logged in a particular day, whereas there is no classification of jammer and events in the Broadsense data. The “jamming penalty” is the only indication of an interfering signal present near the detector. Thus, the timing of the jamming penalty is used to estimate the number of events in a day. The events congruent in time are assumed to be from the same jammer and thus counted as a single event. If there is a gap in time, the event is counted as a new event. The Broadsense data can be used to estimate the number of epochs flagged for interference. The number of flagged epochs is used to calculate percentage of epochs flagged for interference in a particular day by Equation 1.
Percentage of events is an important parameter that can suggest interference duration at a site. A small percentage suggests the jamming signals are short in duration and possibly mobile, whereas large values suggest longer duration events and possibility stationary jammers. The Spirent detector .csv files are used to generate a number of interference events per day. This helps divide the data into low, medium and high frequency days. Such segmentation helps identify the days with a high frequency of
interference events, which are considered prime candidates for further analysis of the entire year’s worth of data.
The second goal of classification is achieved by analyzing data from the Spirent detector. The device helps classify the interferers, based on signal type, into various categories including wide band, narrowband and chirp.
To achieve the third goal of analyzing the severity of events and their potential impact on GNSS-derived positions, the data from high-priority days is examined. Several parameters are considered, including number of measurements, horizontal precision, receiver noise, C/N0, AGC, and the jamming penalty reported by the Broadsense detector. These parameters collectively provide insights into the severity of interference events and their potential effects on GNSS positioning. The Broadsense tracks GPS and GLONASS signals in the L1 band only. Spirent can detect interference on L1 and L5 bands. The focus of the current research is the L1 band.
Results and Analysis
The results are organized keeping research goals in mind. First, we present the findings regarding
interference frequency at the Montréal site, derived from the data collected by both detectors. This analysis provides insights into the occurrence and prevalence of interference events at the site. Second, the type of interferers detected at the site will be discussed. Last, interference impacts on receiver operation are demonstrated using data from a specific day to illustrate severity.
Frequency of Interference
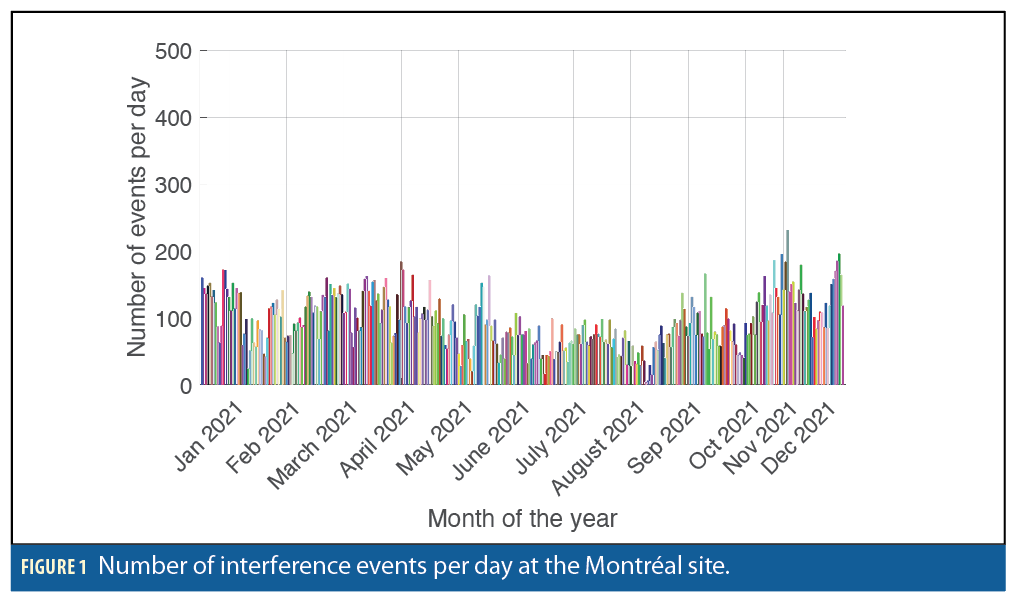
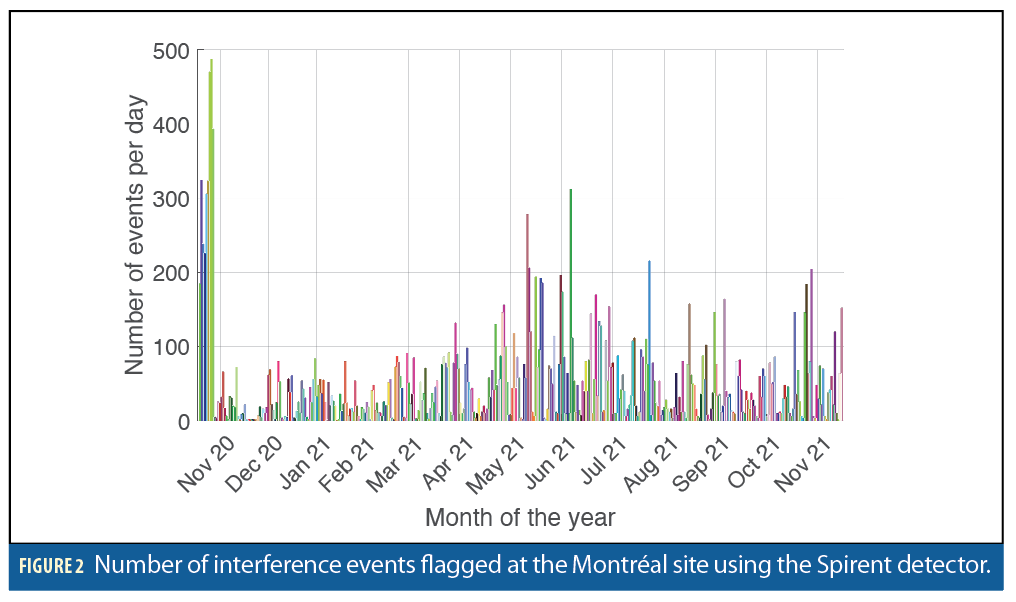
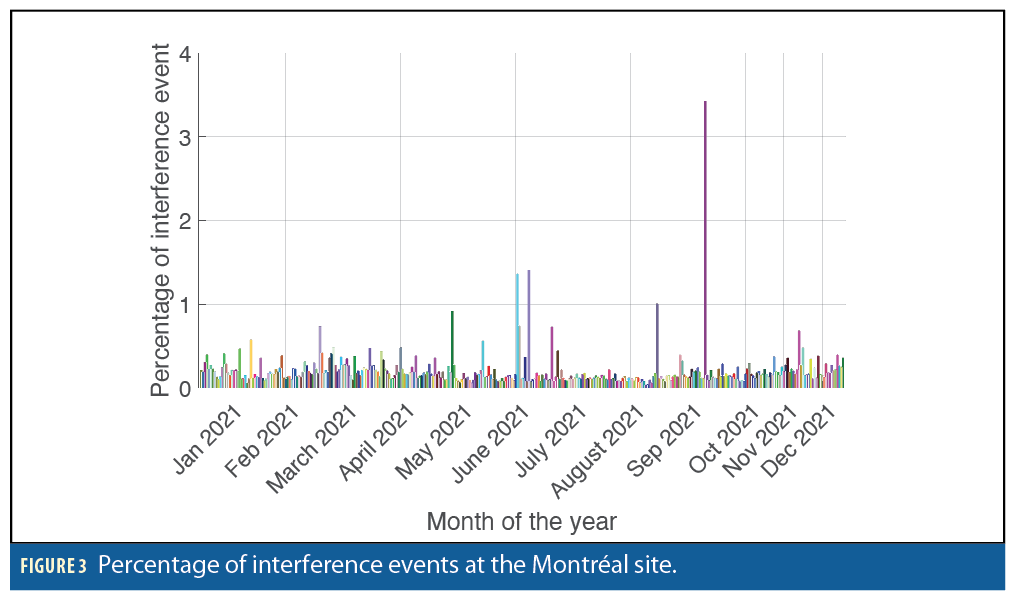
Figures 1 and 2 show the events for the Broadsense and Spirent detectors, respectively. In Figures 1 and 2, the number of events is below 200; however, there is a slight difference between the two detectors. The difference can be due to the sensitivity of detectors and methodology for the detection of events and need further analysis. The Broadsense detector provides a jamming penalty flag indicating the presence of interference. The information is also used to calculate the percentage of epochs affected by jamming events. The actual reason for the large number of events for November 2020 in Figure 2 is not known currently and requires further analysis. The number of events settles into 2021.
Figure 3 shows the detectors sense jamming signals for less than an hour in total in a day at the Montréal site. Thus, it can be hypothesized that jamming events are short duration and jammers are possibly mobile. The figure illustrates that both devices detect interference throughout the year. The number of events each detector senses and the percentage of time each day the detector is exposed to interference, on an average, remains the same except for a few days in which the percentage is an anomaly.
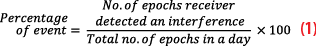
Figure 4 shows that nearly 14% of events at Montréal are classified as high or medium priority events and the rest are low or very low priority. According to Spirent documentation, high and medium priority events can cause a receiver to lose lock. As mentioned, one study goal is to determine the severity of the events detected. Based on the percentage of medium and high priority events, this result is concerning. Although low and very low priority events are not meant to adversely affect advanced receivers, they can have an impact on any vulnerable receivers. Further, without geolocation capabilities, it is not possible to estimate the interferer’s original source power. That estimation would help us better understand if other medium or high priority events may have been detected had the interference source been closer to the detector. Thus, further testing would benefit from geolocation functionality that would provide valuable insights into jammer to signal ratios and the potential for harmful interference.

Types of Interference
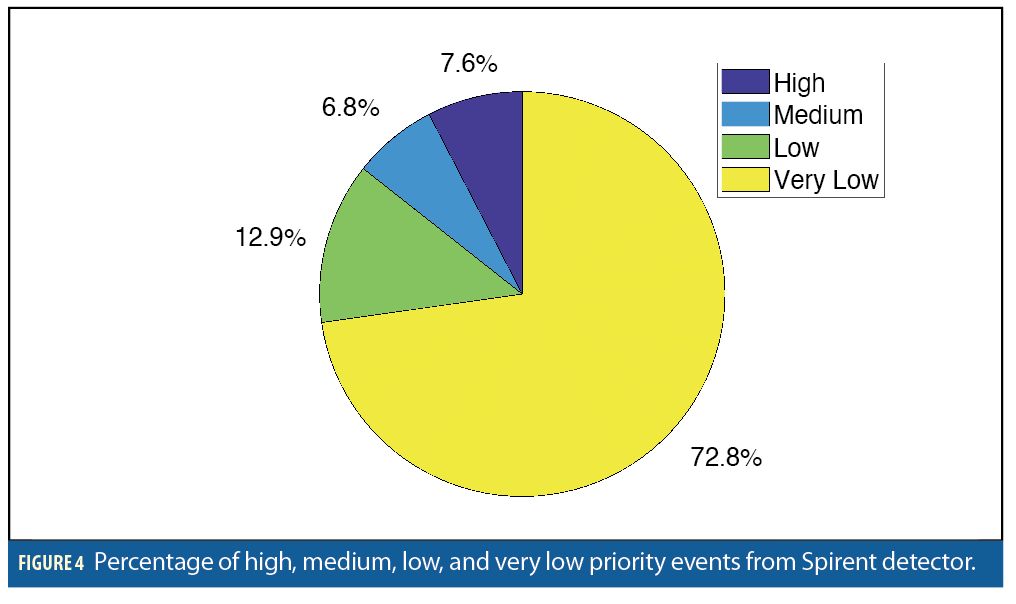
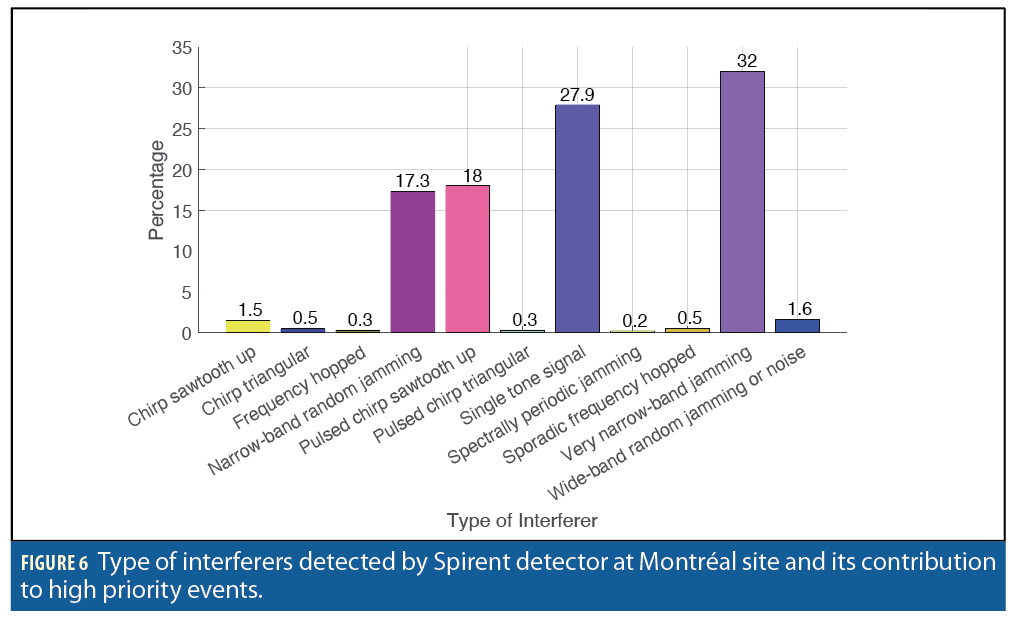
Figure 5 shows there is a direct correlation between power and priority of an event. [21] tested 18 commercially available jammers and discovered they mostly use chirp signals. Also, the distance at which they can cause disruption to GNSS receiver tracking can vary from a few meters to several kilometers. Figure 5 shows that, according to the Spirent GSS200D, the high priority events are mainly due to narrow band, pulsed chirp and single tone jammers. Figure 6 illustrates the high priority events have multiple interference sources. It can be postulated the interference is coming from different sources rather than a single source. The Montréal monitoring site is accessed by commercial vehicles, so intentional jamming using Personal Privacy Devices (PPDs) with chirp and single tone signals may be the cause of most events. Single tone signals are used in certain PPDs, but narrow band jamming typically is not, thus the presence of advanced jammers can be postulated. Testing to validate the GSS200D’s interference classification capabilities would be useful in future work.
Analysis of Datasets from Collocated Receivers
In this section, the analysis results from a specific day are presented to evaluate the severity of an interference event. The primary objective is to demonstrate the impact on various receiver parameters, including receiver noise, the number of tracked satellites, the jamming penalty provided by the Broadsense receiver, and the achieved horizontal accuracy. The correlation between these parameters and important receiver metrics such as C/N0 and AGC count is thoroughly examined. The average C/N0 is used as a criterion to flag events that have the potential to cause a loss of lock on satellite signals. These flagged events are then investigated in detail to assess their impact on satellite tracking. Understanding how these parameters are affected helps to evaluate the robustness and reliability of the GNSS system in the presence of interference.
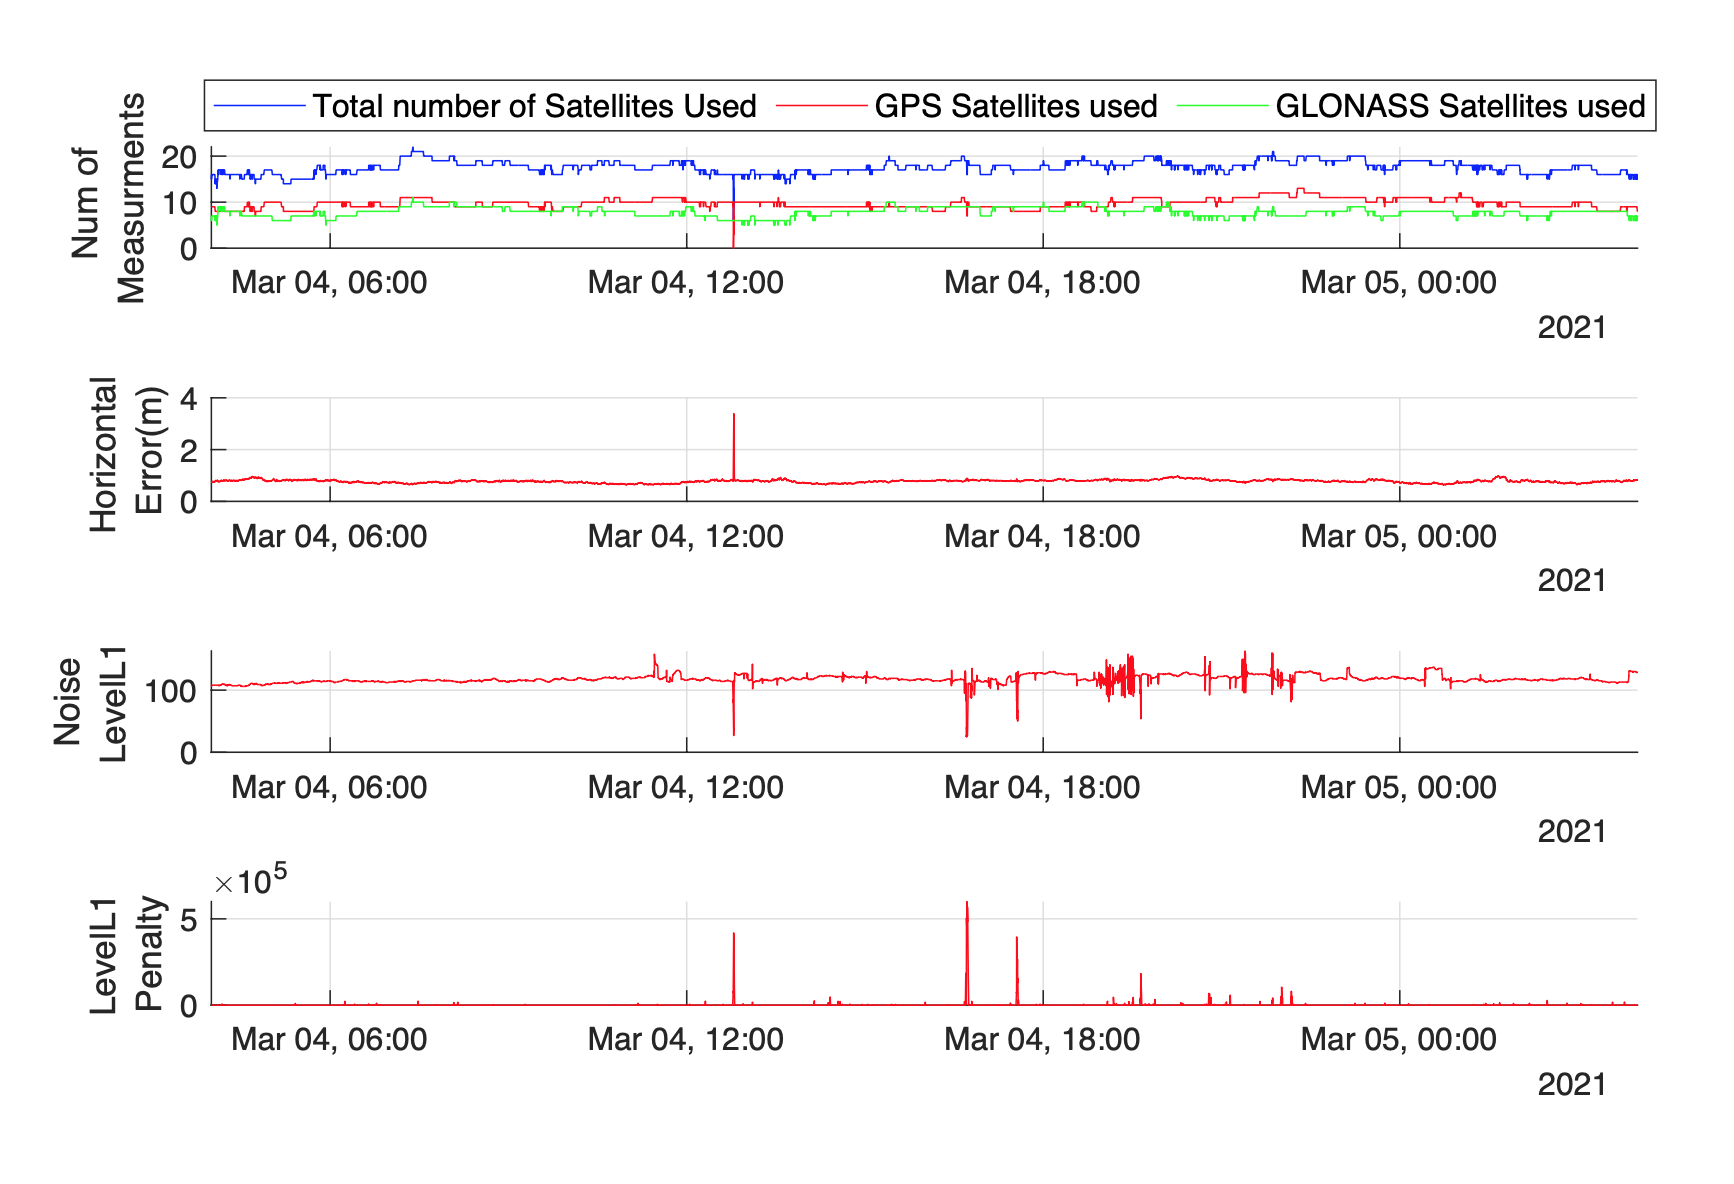
Analysis of March 4, 2021, Dataset with Major RFI Events
Figure 7 shows the timeline of observations of Broadsense parameters for a 24-hour period. There are several notable points, including a decrease in horizontal precision and an increase in error around 12:48 local time accompanied by a decrease in the number of tracked satellites. Only the number of GPS satellites are affected by this event. Additionally, the jamming penalty signal from the Broadsense coincides with the Spirent system detecting a single tone jamming event with a -56.8 dBm power measurement during the same time frame. Receiver noise levels exhibit fluctuations and a noticeable decrease in the value whenever the jamming penalty shows a variation and the receiver detects interference. A uBlox receiver’s noise level parameter is equivalent to signal-to-noise ratio (SNR). The decrease in SNR values indicate a degraded signal, which can be associated with an interference event. Further analysis is required to understand the correlation between the parameter and interference. The .csv file with details of interference events generated by the Spirent detector and the jamming penalty values suggests the presence of jamming events throughout the day.
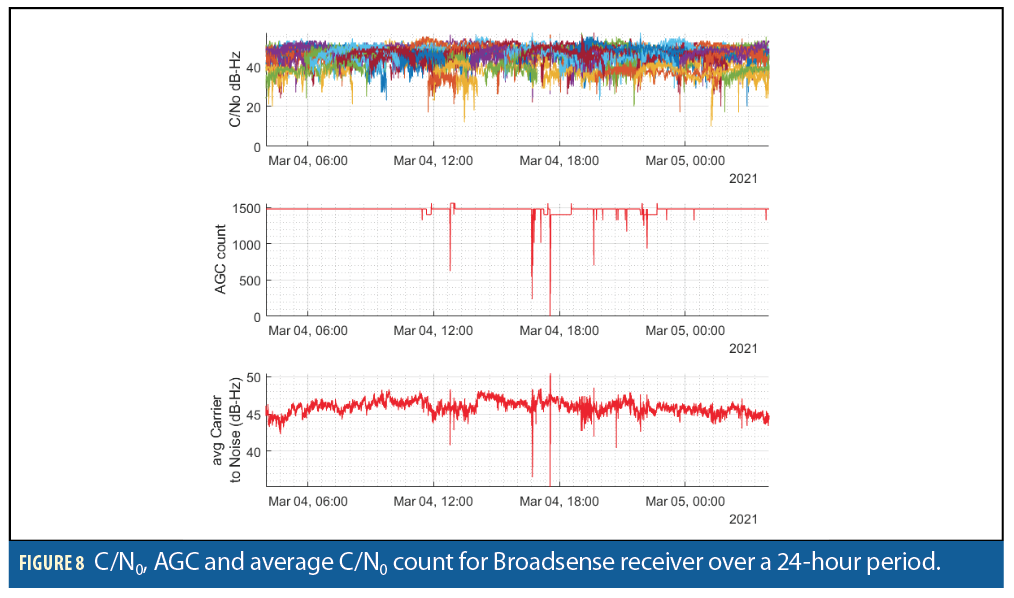
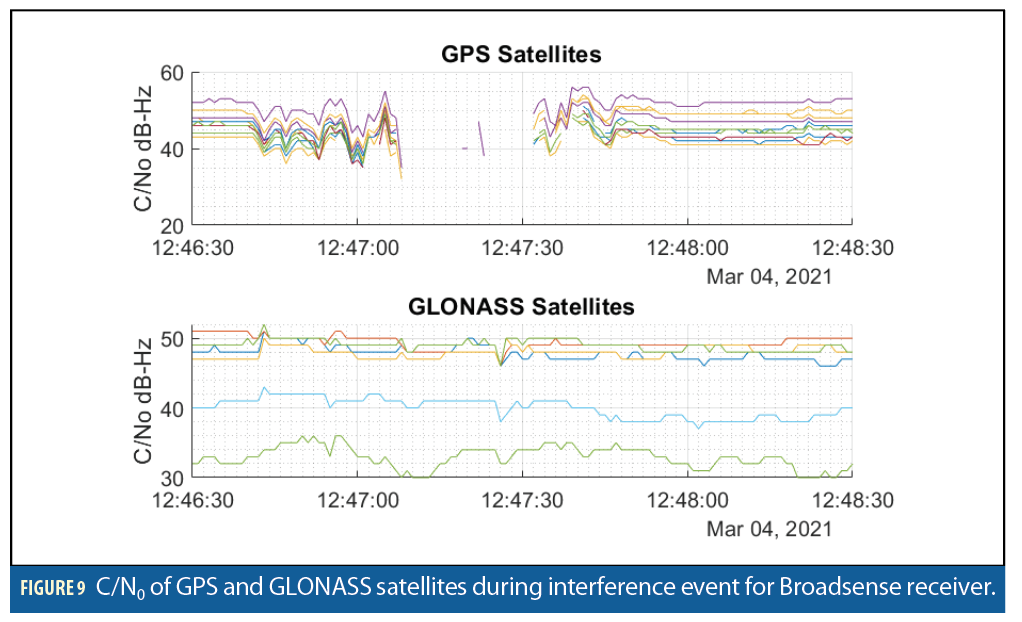
[22] used AGC as a detection flag and pointed out that AGC count decreases when a uBlox receiver is subjected to interfering signals. Similar trends can be seen here, as illustrated in Figure 8. An overview of C/N0 in Figure 8 reveals significant fluctuations that can directly indicate impacts on the receiver. However, the average C/N0 exhibits discernible variations. The average C/N0 and AGC count individually or in combination can serve as useful flags to prompt a closer examination of the events. When an event based on average C/N0 and AGC values is investigated closely, a loss of lock for a 30 s time interval is found as shown in Figure 9. The C/N0 plot in Figure 8 is a combination of GPS and GLONASS signals. As shown in Figure 9, the interference event does not affect GLONASS signals. The GPS satellites are centered at 1575.42 MHz. GLONASS uses frequency modulation and frequencies are decided based on slots as 1602 + slot x 562.5 kHz, where the slot can be [-7,6]. The Spirent detected a single tone interferer around the same time, which might have only impacted the GPS central frequency. Thus, GLONASS satellites appear to not be impacted.
In Figure 8, a noticeable decrease in average C/N0 can be seen throughout the day and especially around 16:40 and 17:33 local time. Further investigation of C/N0 during the events showed it decreased by nearly 20 dB and 10 dB, respectively, for all GPS satellites. Spirent also detected a -54 and -51 dBm very narrow band jamming during both event durations. Interestingly, despite this interference, there is no loss of lock detected. This outcome could potentially be attributed to factors such as the distance of the interferer and type of interference. Further analysis is needed to understand the possible reasons for loss of lock. More detailed analysis of the horizontal precision reported during the events showed a sudden jump of around 0.1 m in both cases. These events highlight that even in the absence of a loss of lock, interference events can still lead to degradation in high accuracy GNSS applications.
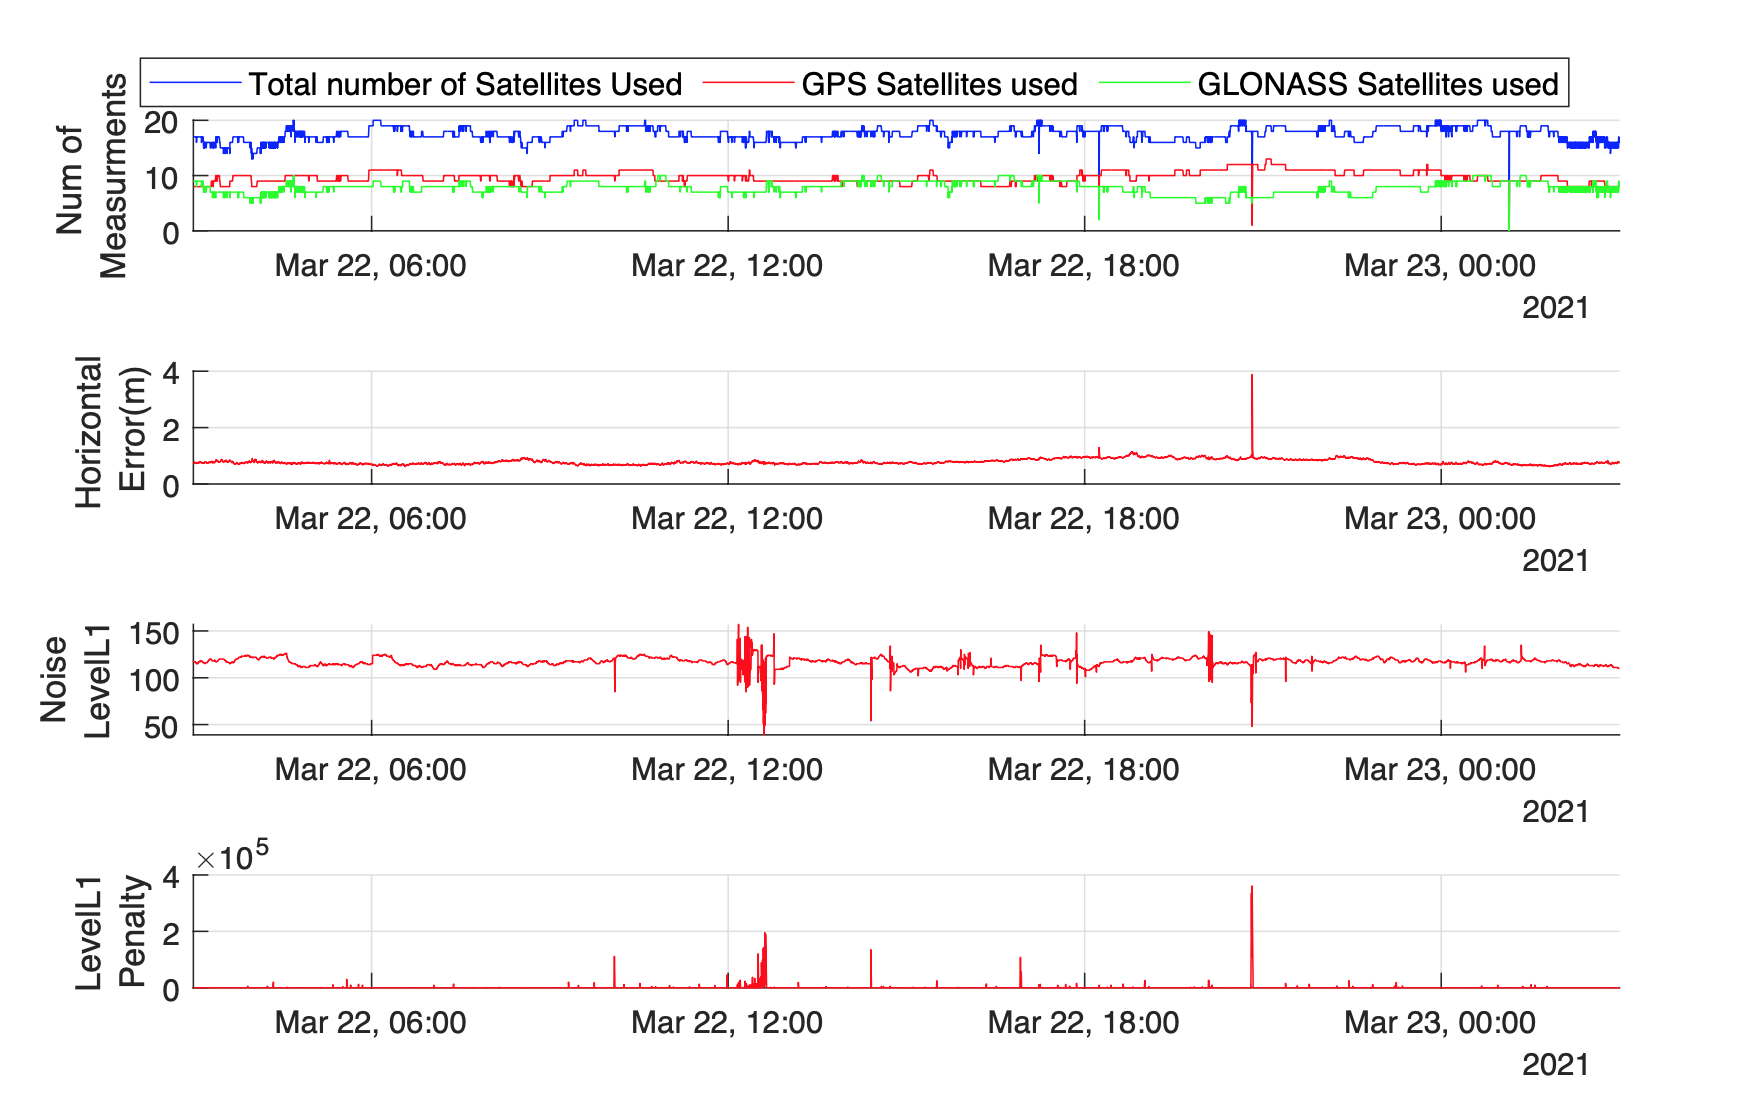

Analysis of March 22, 2021, Dataset with Major RFI Events
The analysis of data from the Montréal site extends to multiple days, including the examination of data from March 22, 2021. Figure 10 shows there is a decrease in the number of satellites being tracked, decrease in GPS and GLONASS satellites around 18:14, GPS satellites around 20:49. Spirent successfully detected the second event, which was characterized as a very narrow-band jamming incident. However, it is important to note the first event, which affected both satellite systems, went unrecorded, presenting an area for potential improvement in monitoring capabilities. Furthermore, during these interference events, there is a discernible degradation in horizontal precision. For the first event, precision decreased by 0.4 meters, while the second event resulted in a more significant drop of 3 meters. These fluctuations in precision clearly indicate the disruptive impact of interference on the tracking system’s accuracy. Additionally, the data exhibits noticeable fluctuations in receiver noise and jamming penalty, which supports the presence of jamming signals.
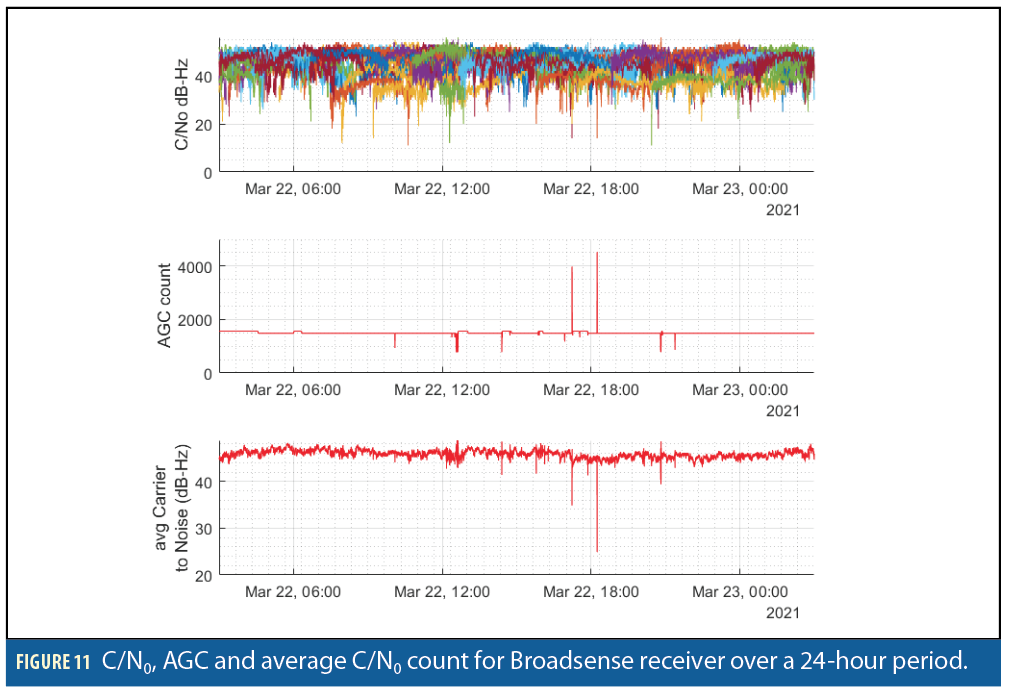
In Figure 11, fluctuations are observable in the C/N0, but the average C/N0 and AGC values offer more distinct variations. Notably, the AGC count generally decreases with an increase in interference, but during the 18:14 interference event, it exhibited an unusual increase. This interference event appears distinct from the narrow-band jamming observed previously, displaying characteristics more in line with a wideband jammer. Consequently, the response of AGC values to such interference can differ significantly. A more comprehensive analysis and testing are essential to validate this hypothesis.
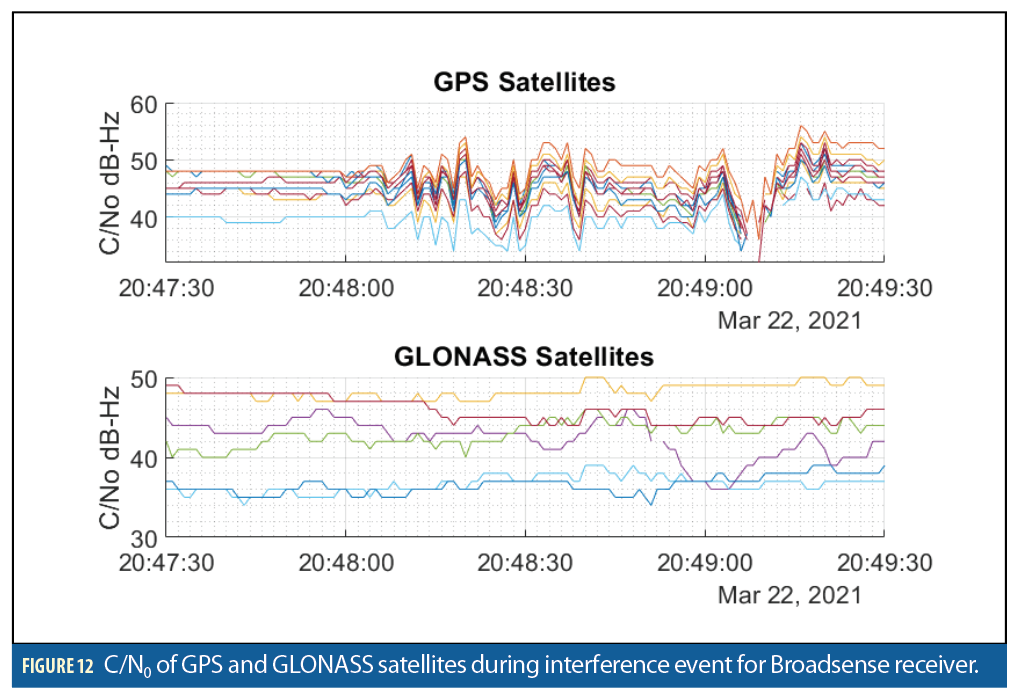
A detailed examination of C/N0 showed that for the 18:14 event both GPS and GLONASS satellites were affected. However, during the 20:49 event, only GPS satellites experienced interference as shown in Figure 12. Spirent also detected an 82 s narrow-band jamming incident around 20:49. The time duration aligns for Broadsense as shown in Figure 12.
Conclusions and Future Work
This article provides valuable insights to Canadian government agencies by determining the frequency, severity and possible impact of GNSS interference events based on data from the Montréal site. The frequency of interference analysis for 2021 shows GNSS receivers are subjected to a few minutes of interference everyday. Approximately 14% of these events have the potential to cause receivers to lose lock.
The research identifies various types of interferers, with chirp, single tone, and narrow band jammers being the major contributors to these events. While chirp and single tone-based jammers are characteristic of PPDs, advanced jammers are postulated for narrow band jamming. Also, the GPS L1 band is being targeted for the data analyzed. The power, duration and distance of these interferers from GNSS receivers vary, impacting event severity. This article highlights the significance of these interference events by examining their effects on satellite C/N0, AGC, receiver noise, and the number of satellites being tracked. The average C/N0, in combination with AGC, proves to be an effective method for flagging interference events. High-powered jammers can cause receivers to lose lock. Even in cases where lock is maintained, significant degradation in C/N0 is observed, leading to poorer horizontal accuracy, which can adversely affect high-accuracy GNSS applications.
In future research, the collected datasets from additional sites will be thoroughly analyzed and compared to the current analysis. Including the Ottawa site, which uses a combination of NovAtel receiver, Spirent GSS200D, and Talen-X Broadsense detector, presents an opportunity to explore the correlation of events across all three devices. This comparative analysis will provide valuable insights into the consistency and reliability of interference detection and classification across different receiver setups. The validation of Spirent detection capabilities also will be covered in future work, which will help detail frequency and time domain classification of the interferers. The current and future work should add to the knowledge base on GNSS interference and help other agencies quickly test and analyze interference events and develop countermeasures as required.
References
(1) Kaplan, E., & Hegarty, C. (2005). Understanding GPS: principles and applications. Artech house.
(2) Bartl, S., Kadletz, M., Berglez, P., & Duša, T. (2021). Findings from Interference Monitoring at a European Airport. 3683–3697. https://doi.org/10.33012/2021.17975
(3) Raghuvanshi, A., Bisnath, S., & Bond, J. (2023). Preliminary Analysis of GNSS Radio Frequency Interference Events Detected in Canada and Impacts on GNSS Based Applications. Proceedings of the 36th International Technical Meeting of the Satellite Division of The Institute of Navigation, 4130–4144.
(4) Fors, K., Stenberg, N., & Nilsson, T. (2021). Using the Swedish CORS Network SWEPOS for GNSS Interference Detection. 4323–4333. https://doi.org/10.33012/2021.18113
(5) Gerrard, N., Rødningsby, A., Morrison, A., Sokolova, N., & Rost, C. (2021). GNSS RFI Monitoring and Classification on Norwegian Highways—An Authority Perspective. 864–878. https://doi.org/10.33012/2021.17952
(6) Jada, S., Bowman, J., Psiaki, M., Fan, C., & Joerger, M. (2022). Time-Frequency Analysis of GNSS Jamming Events Detected on U.S. Highways. 933–946. https://doi.org/10.33012/2022.18528
(7) Bastide, F., Akos, D., Macabiau, C., & Roturier, B. (2003). Automatic gain control (AGC) as an interference assessment tool.
(8) Dimc, F., Bažec, M., Borio, D., Gioia, C., Baldini, G., & Basso, M. (2017). An Experimental Evaluation of Low-Cost GNSS Jamming Sensors: Evaluation of Low-Cost GNSS Jamming Sensors. Navigation, 64(1), 93–109. https://doi.org/10.1002/navi.184
(9) Van Der Merwe, J. R., Franco, D. C., Jdidi, D., Feigl, T., Rugamer, A., & Felber, W. (2022). Low-cost COTS GNSS interference detection and classification platform: Initial results. 2022 International Conference on Localization and GNSS (ICL-GNSS), 1–8. https://doi.org/10.1109/ICL-GNSS54081.2022.9797025
(10) Lindstrom, J., Akos, D. M., Isoz, O., & Junered, M. (2007). GNSS Interference Detection and Localization using a Network of Low Cost Front-End Modules. Proceedings of the 20th International Technical Meeting of the Satellite Division of The Institute of Navigation (ION GNSS 2007), Fort Worth, TX, 1165–1172
(11) Sheridan, K., Ying, Y., & Whitworth, T. (2012). Pre- and Post-Correlation GNSS Interference Detection within Software Defined Radio
(12) Bergström, S., Fors, K., & Linder, S. (2021). Long-term Evaluation of Noise and Interference Statistics in GPS L1-band. 4316–4322. https://doi.org/10.33012/2021.18112
(13) Diez, A., Morrison, A., & Sokolova, N. (2022). Automatic Classification of RFI Events From a Multi-Band Multi-site GNSS Monitoring Network. 3907–3914. https://doi.org/10.33012/2022.18572
(14) Bhuiyan, M. Z. H., Kuusniemi, H., Söderholm, S., & Airos, E. (2014). The Impact of Interference on GNSS Receiver Observables—A Running Digital Sum Based Simple Jammer Detector. 23(3).
(15) De Wilde, W., Cuypers, G., Sleewaegen, J.-M., Deurloo, R., & Bougard, B. (2016). GNSS Interference in Unmanned Aerial Systems. 1465–1476. https://doi.org/10.33012/2016.14674
(16) Larsen, S. S., Olesen, D. H., Jensen, A. B. O., Elsholm, B. B., & Stenseng, L. (2022). Assessment of RFI Geolocation Using Modern Android Smartphones. 3888–3906. https://doi.org/10.33012/2022.18571
(17) Liu, Z., Blanch, J., Lo, S., & Walter, T. (2023). Investigation of GPS Interference Events with Refinement on the Localization Algorithm. 327–338. https://doi.org/10.33012/2023.18627
(18) Osechas, O., Fohlmeister, F., Dautermann, T., & Felux, M. (2022). Impact of GNSS-Band Radio Interference on Operational Avionics. NAVIGATION: Journal of the Institute of Navigation, 69(2), navi.516. https://doi.org/10.33012/navi.516
(19) Potter, B. J., Shallberg, K., & Grabowski, J. (2012). Personal Privacy Device Interference in the WAAS. Proceedings of the 25th International Technical Meeting of the Satellite Division of The Institute of Navigation (ION GNSS 2012), 2868–2874.
(20) Ziebold, R., Romanovas, M., & Gewies, S. (2016). Experimental Evaluation of the Impact of Jamming on Maritime Navigation. 3461–3480. https://doi.org/10.33012/2016.14810
(21) Mitch, R. H., Dougherty, R. C., Psiaki, M. L., Powell, S. P., O’Hanlon, B. W., Bhatti, J. A., & Humphreys, T. E. (n.d.). Signal Characteristics of Civil GPS Jammers.
(22) Rødningsby, A., Morrison, A., Sokolova, N., Gerrard, N., & Rost, C. (2020). RFI Monitoring of GNSS Signals on Norwegian Highways. 3536–3549. https://doi.org/10.33012/2020.17671
Acknowledgments
The authors would like to thank Innovation Science and Economic Development (Spectrum Management), Fisheries and Oceans Canada (Canadian Coast Guard), Natural Resources Canada (Canadian Geodetic Survey) and NAV CANADA for their contributions to the field tests enabling the data collection for this analysis.
This article is based on material presented in a technical paper at ION GNSS+ 2023, available at ion.org/publications/order-publications.cfm.
Authors
Anurag Raghuvanshi is a post doctoral visitor at York University, Toronto, Canada, involved in high accuracy GNSS research. He received his M.S.E.E and PhD Degree from Ohio University. He is an ION member, and his research interests are aircraft precision approach, autonomous vehicles, high accuracy GNSS and its integration with other navigation sensors. He has also worked as a Systems Engineer at Honeywell Aerospace.
Sunil Bisnath is a professor in the Department of Earth and Space Science and Engineering at York University, Toronto, Canada. He received his Ph.D. in Geodesy and Geomatics Engineering from the University of New Brunswick. For 30 years, he has actively researched GNSS processing algorithms for positioning and navigation applications.
Jason Bond is a lead engineer in the Canadian Positioning, Navigation and Timing Office in the Department of Innovation, Science and Economic Development. He received his Ph.D. in Geodesy and Geomatics Engineering from the University of New Brunswick. He has traversed both private and public sectors over the past 25 years specializing in the use of GNSS for engineering surveys and more recently in investigating resilient PNT options.


 and European Frequency and Time Forum (EFTF)")
