GPS satellites usually transmit their signals with constant power. However, a so-called “Flex Power” is foreseen to increase the strength of individual signals to better fulfill operational constraints. Flex power operations can be detected in carrier-to-noise density ratio (C/N0) observations provided by GNSS receivers of the global tracking network of the International GNSS Service (IGS).
For open service signals such as L1 C/A and L2C, changes in signal powers show up directly in the measured C/N0 of respective observations. P(Y)-code signals, in contrast, are encrypted, and a semi-codeless tracking approach is used by common geodetic GNSS receivers. However, this technique results in significant losses in the measured C/N0 compared to unencrypted signals and results in identical C/N0 values for L1 P(Y) and L2 P(Y). Therefore, a determination of frequency-specific signal power changes from C/N0 measurements of geodetic receivers is not possible for the P(Y) signals.
Measurements with a high-gain antenna offer a more detailed analysis of the transmit power distribution. The German Aerospace Center (DLR) operates a 30 m high-gain antenna at its ground station in Weilheim, Germany. This antenna is regularly utilized for GNSS signal monitoring (Thoelert et al.) and was already used for recent flex power analysis.
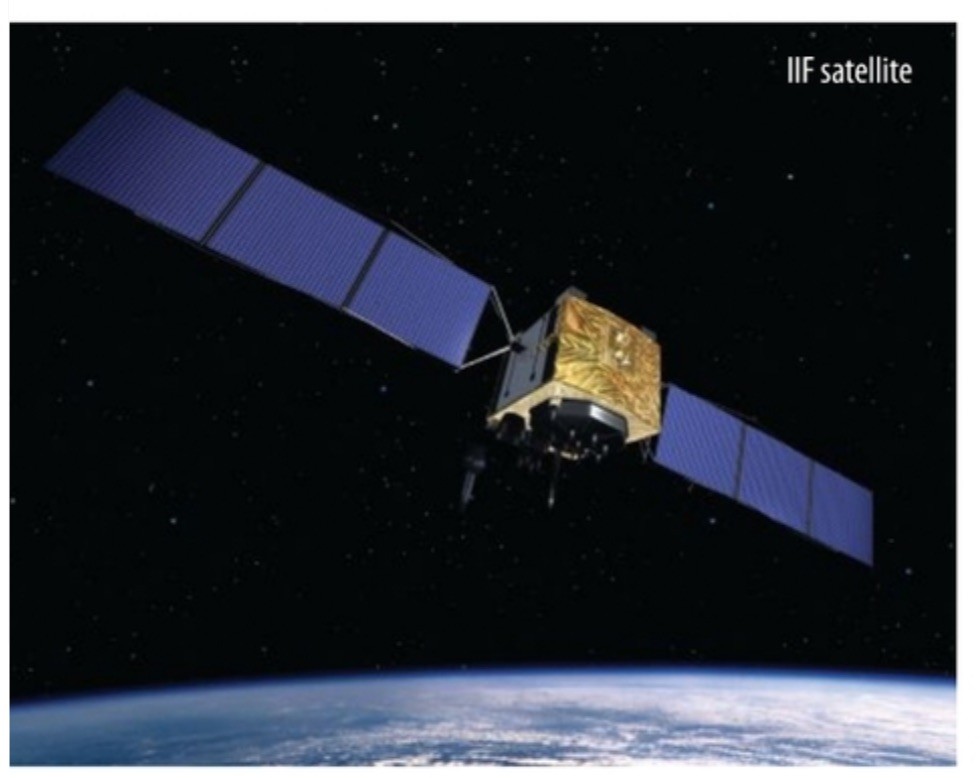
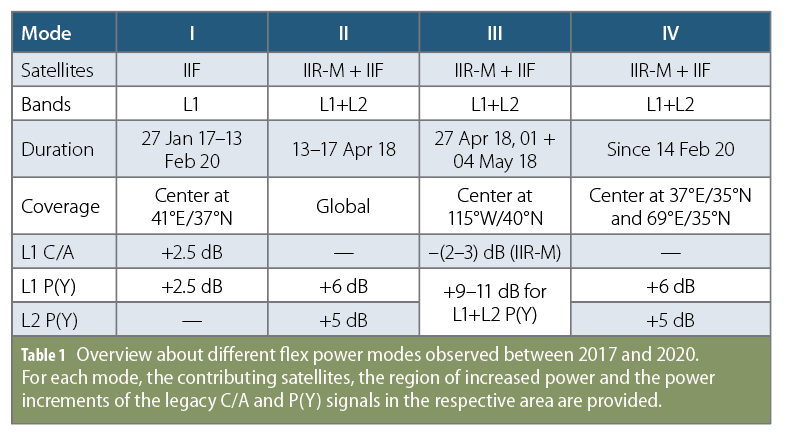
Table 1 lists three different types of previous flex power operations. The regional flex power mode I was active on all Block IIF satellites for more than three years. It affected the L1 C/A-code and L1 P(Y)-code signals with a power increase of about 2.5 dB. Dedicated flex power campaigns with a duration of one or a few days occurred in spring 2018. Mode II is the only flex power mode that was globally active on all healthy Block IIR-M and IIF satellites. Using measurements of DLR’s high-gain antenna, the individual L1 P(Y) and L2 P(Y) power changes could be determined. No such measurements are available for mode III. Therefore, only the sum of the L1+L2 power change could be obtained from C/N0 analysis.
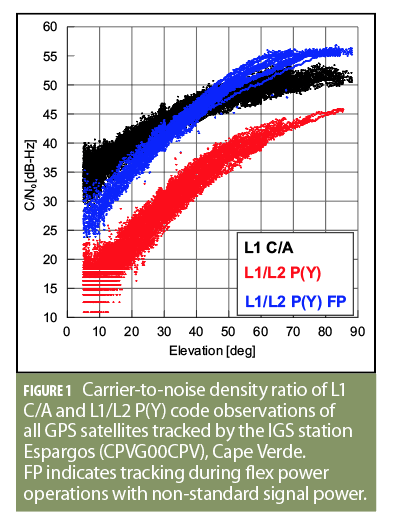
Starting on February 14, 2020, a new flex power mode IV could be detected. It replaces mode I but affects the L1 and L2 P(Y) signals whereas the power of L1 C/A does not change. Figure 1 shows the carrier-to-noise density ratio of a Trimble NetR9 receiver at the IGS station Espargos, Cape Verde. During normal operations, plotted in red, the P(Y)-code observations show C/N0 values of up to 45 dB-Hz. Depending on the elevation, these values are smaller by 5-20 dB than for the civil L1 C/A signal due to the semi-codeless losses. During periods of non-standard power in flex power mode IV (shown in blue), the L1 and L2 P(Y) carrier-to-noise density ratio increases by roughly 10 dB and even exceeds the L1 C/A C/N0 by up to 5 dB for high elevations.
Flex Power Mode IV
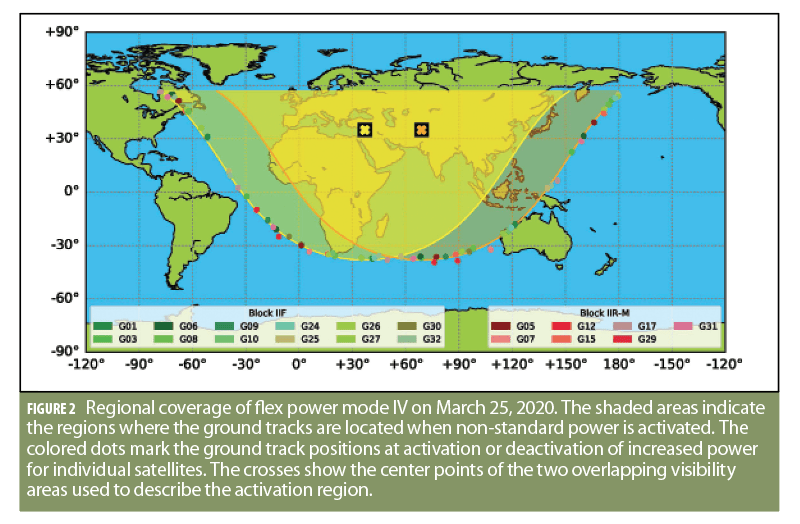
Like flex power mode I, mode IV has a regional coverage area. However, it is more complex and cannot be described by a simple center point. Analysis of the satellites’ footprints at the flex power switching times revealed that the zone of non-standard power levels can be described in good approximation by superposition of the visibility areas for observers located at 37°E/35°N and 69°E/35°N, respectively, using a 3° elevation mask. The flex power mode IV coverage area as well as the locations of the Block IIR-M and IIF satellites at activation or deactivation of flex power are shown in Figure 2 for a sample day.
Measurements with the Weilheim 30 m antenna revealed transmit power changes of +6 dB for L1 P(Y) and +5 dB for L2 P(Y) for mode IV whereas the L1 C/A and L2C power levels stay essentially constant. The power increase of the P(Y) signals is possible due to a complete deactivation of the military M-code on L1 and L2 as it was also done for mode II in April 2018.
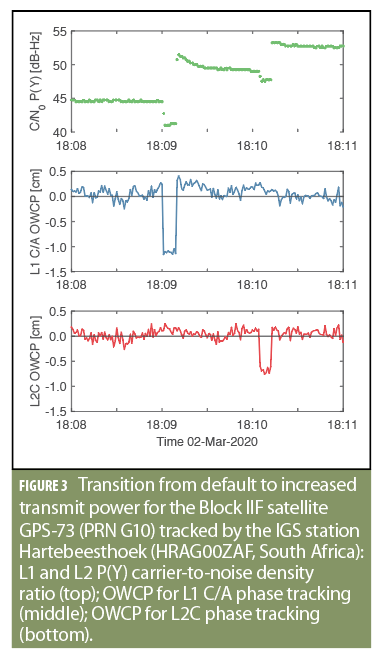
Closer inspection of high-rate C/N0 observations with 1 Hz sampling reveals that the shape of transitions from default to increased transmit power and vice versa are different for Block IIR-M and Block IIF satellites. Block IIR-M satellites show an instantaneous change of the power levels. However, Block IIF satellites show multiple steps as illustrated in the top plot of Figure 3. An intermediate power level for a duration of about 50 s is obvious as well as two short periods of about 10 s each with a few decibels power drop directly before the actual power increases. These drops are not present for the transition from increased to default power level. In this case, only the intermediate power level occurs.
One-Way Carrier-Phase Residuals
Sgammini and Martini already reported spikes in ionosphere-free carrier phase residuals that are related to transmit power level transitions. In the following, residuals of a one-way carrier phase (OWCP) analysis of L1 C/A and L2C phase signals are analyzed. For this OWCP analysis, single-frequency carrier phase observations of a GNSS receiver connected to a hydrogen maser are used. After subtracting the geometric range variation based on the known satellite orbit and station positions, the remaining values are detrended by a first-order polynomial. In this way the clock offset and drift of the highly stable external clock as well as atmospheric delays can sufficiently well be removed over short time scales of a few minutes. The resulting OWCP residuals essentially contain information about the satellite clock as well as effects introduced by changes in the signal generation. The middle and bottom plot of Figure 3 show phase glitches of about 1.5 cm for the L1 C/A phase and about 1 cm for the L2C phase. The glitches have a duration of about 10 s and coincide with the drops in the carrier-to-noise density ratio shown in the top plot of Figure 3. As the first glitch occurs in the L1 C/A phase, it is reasonable to assume that the L1 power is raised first, followed by L2 about a minute later. For the transition from increased to default power, no such glitches are visible.
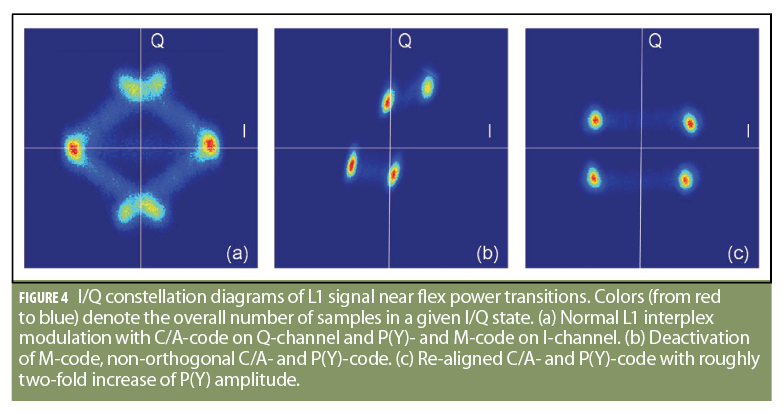
Figure 4 shows three L1 IQ constellation plots illustrating the distribution of in-phase (I) and quadrature (Q) channel components for default and increased power levels, as well as for the short time period during the L1 phase glitch. The diagrams are based on measurements of the Block IIF satellite GPS-71 (G26) with the Weilheim high-gain antenna. The left plot shows the transmission of three different signals, namely the C/A-code on the Q-channel and the P(Y)- and M-code on the I-channel. The interplex modulation used for the combination of the three signals introduces eight stationary points. However, the four stationary points next to the I-axis are so close to each other that they appear as two points with an increased number of samples. In the middle plot, the M-code as well as the interplex modulation are not present anymore and only the binary phase-shift keying (BPSK) signals of the C/A- and P(Y)-code are visible. However, both signals are not orthogonal during this intermediate power phase and the resulting stationary points are not aligned w.r.t. the I- and Q-axis. In the right plot, the C/A- and P(Y)-code are again aligned resulting in four evenly distributed stationary points of a nominal quadrature phase shift keying (QPSK) modulation.
DCB Changes
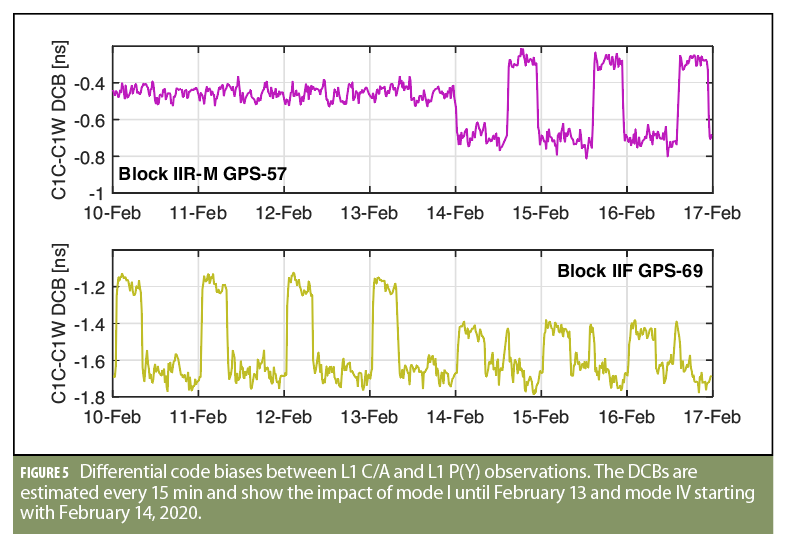
Transmit power changes are not only visible in the carrier-to-noise density ratio but also in differential code bias (DCB) estimates. Figure 5 shows 15 min DCB estimates for the time interval February 10-16, 2020, obtained with the approach of Montenbruck et al. The contributing signals are indicated by their RINEX identifiers, namely C1C for the L1 C/A code and C1W for semi-codeless tracking of L1 P(Y). During mode I, no C1C-C1W DCB changes can be seen for Block IIR-M satellites as mode I is limited to Block IIF satellites. Starting with February 14, 2020, regular DCB changes of about 0.4 ns associated with increased L1 transmit power can be seen for Block IIR-M satellite GPS-57. For the other Block IIR-M satellites, the DCB changes range from almost zero to 0.6 ns.
For the Block IIF satellites, pronounced C1C-C1W DCB changes can already be seen during mode I, e.g., 0.5 ns for GPS-69 shown in Figure 5 (bottom). These changes are smaller by a factor of about two starting with the transition to mode IV on February 14, 2020. Half of the Block IIF satellites show a similar behavior, four satellites show an increased C1C-C1W DCB change in mode IV compared to mode I, and for two satellites, no changes are obvious. The impact of the different spatial coverage of mode IV can also be seen in in Figure 5 (bottom). In addition to the roughly 8 h of increased L1 P(Y) power each morning in mode I as well as IV, additional DCB peaks can be seen around 14:00 due to an additional hour with increased power for mode IV only.
The order of magnitude of DCB changes of mode IV does not exceed the other flex power modes observed before. Therefore, the conclusion of Steigenberger et al. that high-precision GPS users are likely not adversely affected by flex power appears still valid.
Acknowledgement
The International GNSS Service (IGS) is acknowledged for providing GNSS observation data. The authors want to thank their colleagues from the German Space Operations Center (GSOC) for supporting and operating the high-gain antenna at DLR’s ground station Weilheim, Germany.
Manufacturers
The C/N0 and OWCP analysis are based on GPS tracking data obtained with Trimble NetR9 and Javad TRE_G3TH receivers. The input data for the IQ constellation plots were recorded with a Spirent GSS6450 GNSS RF Record & Playback System.