
Incidents of GNSS signals that contain phase anomalies in a way as to mimic ionospheric scintillation have been observed in the past years. Although it is challenging to differentiate an oscillator anomaly from ionospheric scintillation, their underlying physics are different and show different carrier frequency dependency. Machine learning models using extensive GNSS databases can automatically detect satellite oscillator anomaly events.
Yunxiang Liu, University of Colorado, Boulder
Y. Jade Morton, University of Colorado, Boulder
A: GNSS technology, designed to offer PNT services on a global scale, is critical to modern society. Its capability to provide global, 24/7 coverage of PNT services makes countless applications possible. The extremely high demand for GNSS services makes the stability of the onboard oscillators of paramount importance, as their performance impacts all users that rely on GNSS signal integrity. Satellite oscillator anomalies are typically monitored by GNSS ground control segments and ground monitoring receivers using algorithms that detect large deviations in carrier-phase estimations. In this column, we review the subject and present two machine learning-based methods that can detect both large and micro-scale anomalies.
What Is Satellite Oscillator Anomaly?
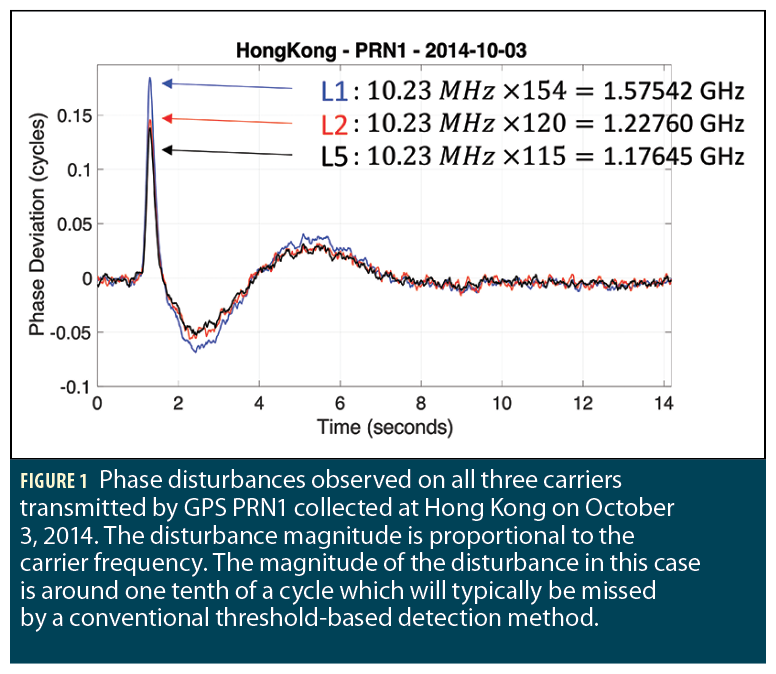
Satellite oscillator anomaly is manifested as phase disturbances on the transmitted signal. A modern GNSS satellite transmits signals at multiple carrier frequencies, each derived from the same oscillator, meaning that each carrier frequency is proportional to the oscillator frequency. Therefore, carrier-phase disturbances due to oscillator anomalies are also proportional to the carrier frequency. An example of the GPS satellite oscillator anomaly observed by a ground receiver at Hong Kong is shown in Figure 1. Phase measurements from GPS carrier frequencies L1, L2, and L5 are illustrated, where each carrier frequency is a multiple of the oscillator frequency operating at 10.23 MHz. The property of carrier frequency dependence can be observed from the disturbance magnitude, which is proportional to the carrier frequency. Later on, this carrier frequency dependence will be utilized in the design of satellite oscillator anomaly detection methods.
Anomaly Impact
GNSS signal-in-space (SIS) quality is fundamental to the operation and accuracy of the obtained PNT solutions. Satellite oscillator anomalies are manifested as SIS carrier-phase disturbances. Their occurrence may be led by changes in state of the satellite clock [3]–[5]. Large anomalies may lead to degradation of precision, service discontinuity, loss of augmentation correction service such as the Wide Area Augmentation System (WAAS), or even outage, ultimately impacting the accuracy and integrity of GNSS applications [1], [6]–[10]. Therefore, it is important to monitor and provide a timely warning of anomaly occurrence. In addition, characterization of the anomaly will help to improve monitoring system performance [11] and enable the investigation of the cause of these events [6]. Furthermore, the characterization also provides guidance on future navigation satellite system and satellite oscillator design in order to avoid these glitches, which is of great interest to GNSS satellite manufacturers.
Anomaly Detection
Traditional threshold-based detection methods may be effective in capturing large phase disturbances [13]. They do not work well for oscillator anomalies that have relatively small magnitude, as shown in Figure 1. Furthermore, phase disturbances due to oscillator anomalies often appear to have features similar to ionospheric phase scintillation [14], [15]. Ionospheric phase scintillation refers to rapid phase fluctuations of the GNSS signals propagating through ionospheric plasma irregularities, which is typically due to a combination of refractive and diffractive effects. Although the refractive effects can be removed by dual-frequency measurements or ionospheric models, the diffractive effects introduce random carrier-phase fluctuations and cannot be removed by these methods [16]. Another method of detecting satellite oscillator anomalies is using two nearby receiver measurements to distinguish the satellite oscillator anomaly from ionospheric scintillation and receiver oscillator anomaly [17], [18]. A satellite oscillator anomaly is identified by observing the same anomaly from two receivers. A major shortcoming of this approach is that the requirement of two receivers makes it difficult to apply to existing monitoring systems, and any updates to the existing system will be costly.
Machine learning (ML)-based satellite oscillator anomaly detection can overcome existing methods’ disadvantages. An essential component of an ML algorithm is to use domain knowledge of the data to create features that are representative of the type of phenomena or events of interest. In GNSS measurements, the unique distinction between the carrier-phase disturbances generated by satellite oscillator anomaly and ionospheric scintillation is their dependence on carrier frequency. While carrier-phase disturbances due to oscillator anomalies are proportional to the carrier frequency, statistical indicators of the phase disturbances associated with weak to moderate scintillation are inversely proportional to the carrier frequency [19].
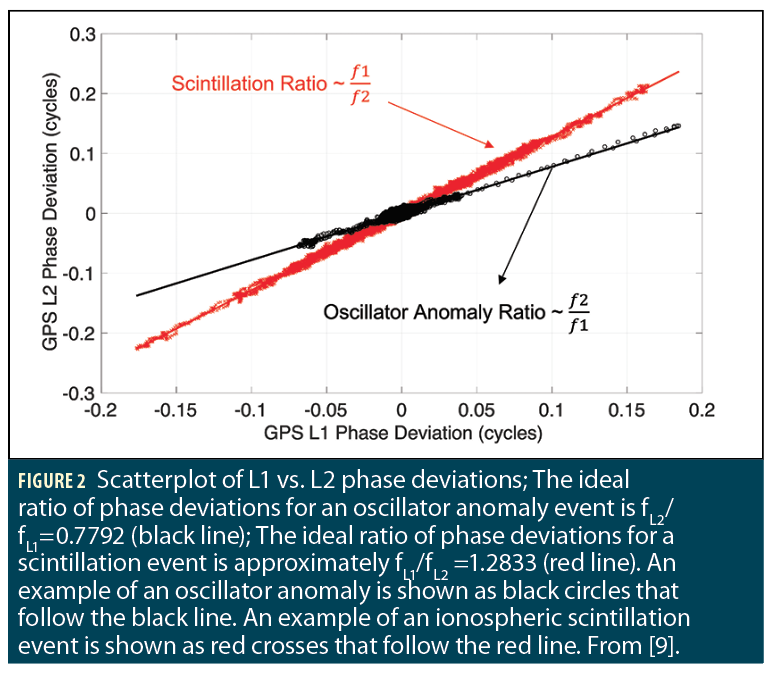
For strong scintillation, this inverse proportionality breaks down, but it is still distinctively different from that of oscillator anomalies. Figure 2 shows an example of GPS L1 vs. L2 phase deviation relationships for an oscillator anomaly event (black) and an ionospheric scintillation event (red) [9]. These phase deviations are computed using detrended carrier-phase measurements. The oscillator anomaly example in black circles follows the black line with a slope that is equal to the ratio of L2 to L1 carrier frequency, while the scintillation example in red crosses follows the red line with a slope that is equal to the ratio of L1 to L2 carrier frequency. This matches our expectation that the magnitude of phase deviations for oscillator anomalies is proportional to carrier frequency while the magnitude for scintillation is inversely proportional to carrier frequency.
Therefore, the slope of phase deviations between two carriers is an important input feature for ML algorithms to identify oscillator anomalies. For satellites transmitting triple-frequency carriers, the feature vector includes carrier deviation ratio for L1/ L2, L1/ L5, L2/L5, L2/L1, L5/L1, and L5/L2. Other useful input features for ML algorithms include the power spectral density (PSD) of the phase measurements and the corresponding maximum value of the PSD. References [9], [20] have detailed descriptions of the feature choices.
Two ML algorithms were developed to utilize these features as inputs for satellite oscillator anomaly detection. Here, machine learning algorithms are used as classifiers that take these features extracted from phase measurements to identify the class of the measurements. The first algorithm is dubbed SVM-RBF SVM which consists of three stages: phase disturbance detection using a linear support vector machine (SVM), oscillator anomaly identification from the detected phase disturbances using a radial basis function (RBF) SVM, and classification of oscillator anomalies into satellite and receiver oscillator anomalies.
While the first two stages involve implementation of ML algorithms, the last stage is simply achieved by examination of signals received from multiple satellites: if all satellite signals experience the same pattern of phase disturbance, then the disturbance must be due to the receiver oscillator; otherwise, the disturbance must have originated from a satellite.
Figure 3 shows a block diagram of the SVM-RBF SVM algorithm. This 3-stage algorithm was developed to utilize our prior work (the SVM in stage 1) to detect ionospheric scintillation [21]. The SVM in stage 1 set the lower bound on the level of anomalies that can be detected. Details of this method were discussed in [9].
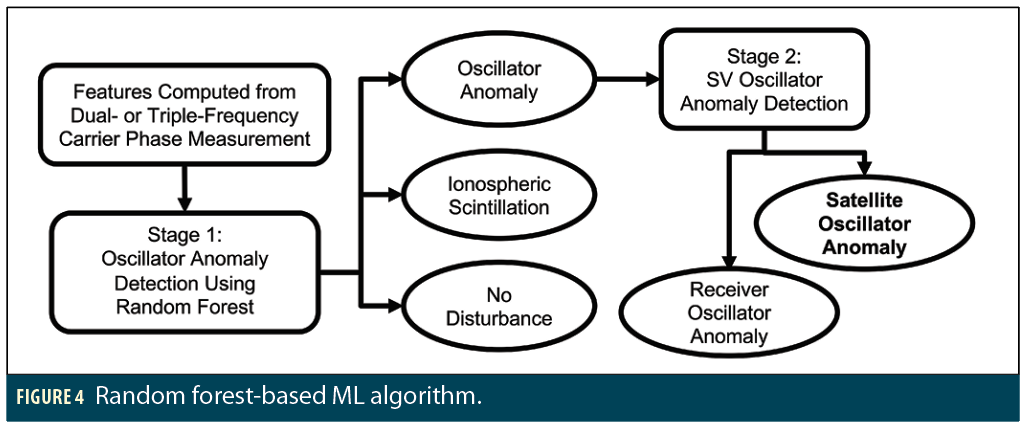
A random forest-based ML algorithm involving only 2 stages of processing (see Figure 4) was developed to reduce the cumbersome nature of the SVM-RBF SVM algorithm. The algorithm uses the same features as the 3-stage SVM-RBF SVM algorithm. Its first stage is the random forest implementation that classifies the phase disturbances into three classes: oscillator anomaly, ionospheric scintillation, and quiet signals with no disturbances. The oscillator anomaly class is further classified into satellite and receiver oscillator anomalies using the same approach as in the earlier method. The random forest ML method is presented in [20].
Both methods have been trained, tested, and validated using the data collected by receivers located in Greenland, Alaska, South Korea, Puerto Rico and Chile. These receivers are part of the University of Colorado GNSS monitoring networks. Over 900 days of data were used in the study.
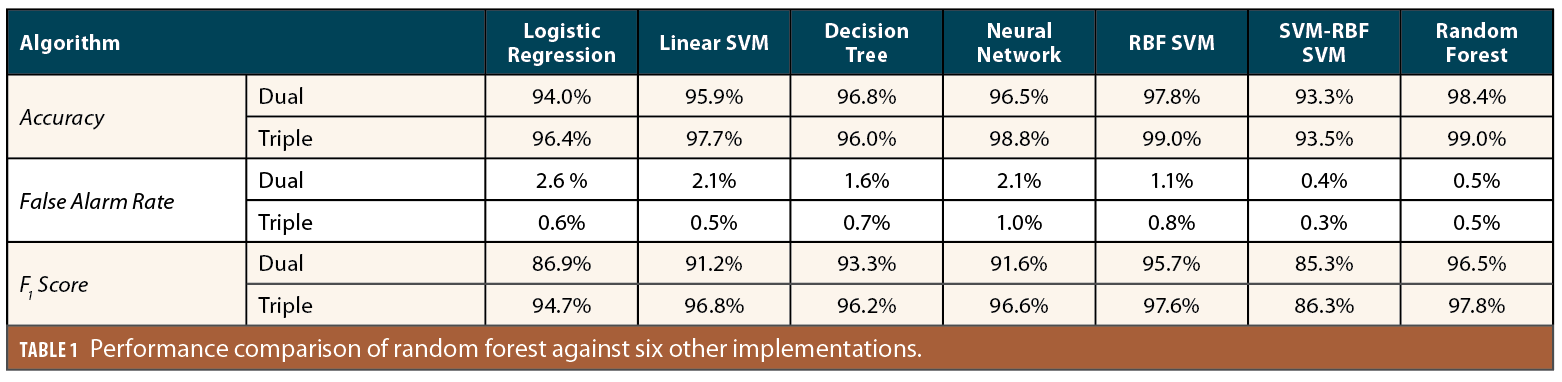
Table 1 summarizes the accuracy, false alarm rate, and the F1 score, which is defined as the harmonic mean of two performance metrics: recall and precision. The F1 score is useful for evaluating the performance of an imbalanced dataset in which the events of interests occur at a very infrequent rate. A higher F1 score indicates a better performance.
The methods used in the comparative study are all ML-based methods, consisting of logistic regression, linear SVM, decision tree, neural network, RBF-SVM, the SVM-RBF SVM shown in Figure 3, and the random forest shown in Figure 4. Both dual- and triple-frequency data were used in the assessment. The results show that the random forest-based ML algorithm has the best performance. In addition, triple-frequency data shows better performance in every measure and for every method implemented.
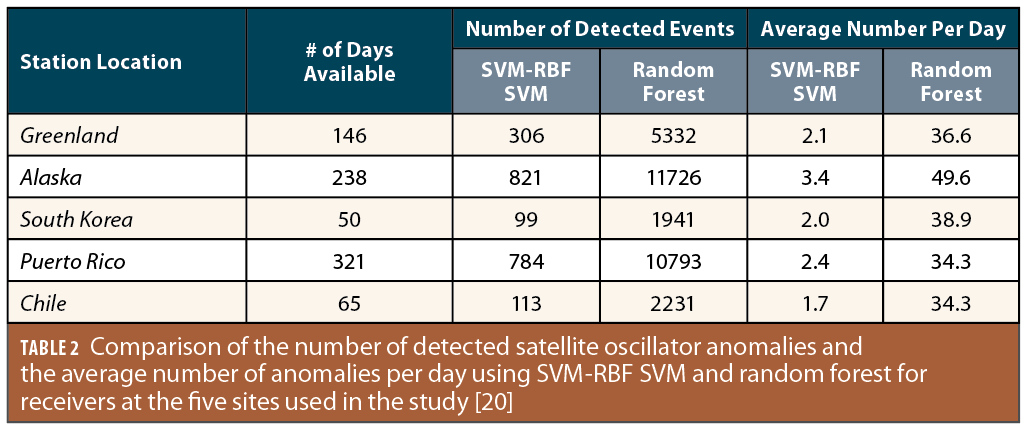
Both methods have also been applied to data collected from multiple locations to conduct the automatic satellite oscillator anomaly detection. A surprising outcome of the random forest algorithm is the order of magnitude increase in the number of detected satellite oscillator anomaly events. Table 2 compares the number of detected events using SVM-RBF SVM and the random forest algorithm for each receiver location. Also listed in the table is the average number of events per day. For receivers at all five sites used in this study, an average of 34–50 satellite oscillator anomalies were detected by random forest.
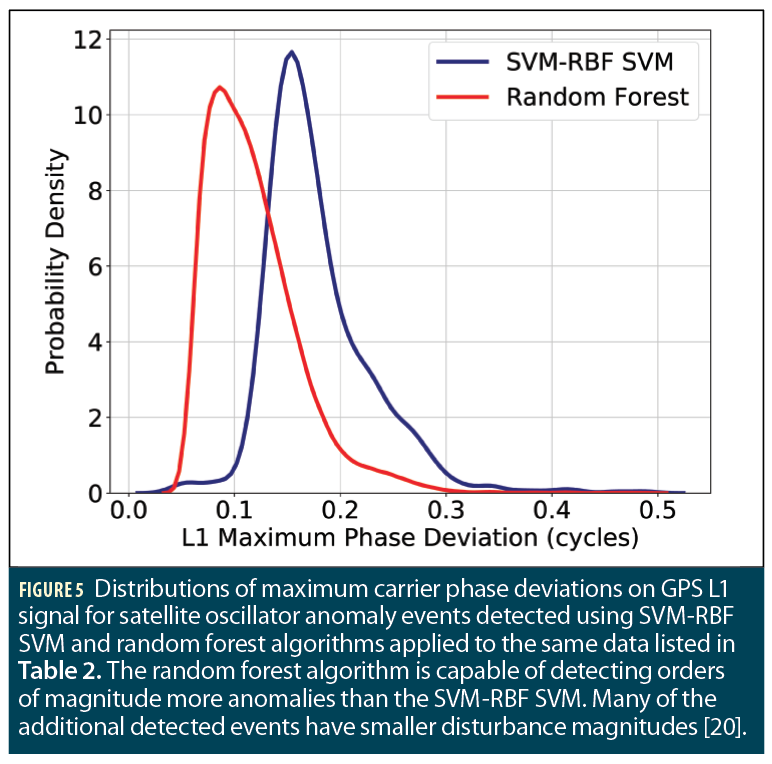
One of the reasons for the large number of additional anomalies detected by the random forest algorithm is its ability to detect smaller magnitude anomalies. Figure 5 plots the distribution of the maximum L1 phase deviation for the detected events using SVM-RBF SVM and random forest. While the peak of L1 maximum phase deviation is around 0.15 cycles for the events detected by SVM-RBF SVM, this value is significantly smaller, at about 0.08 cycles, for the random forest algorithm.
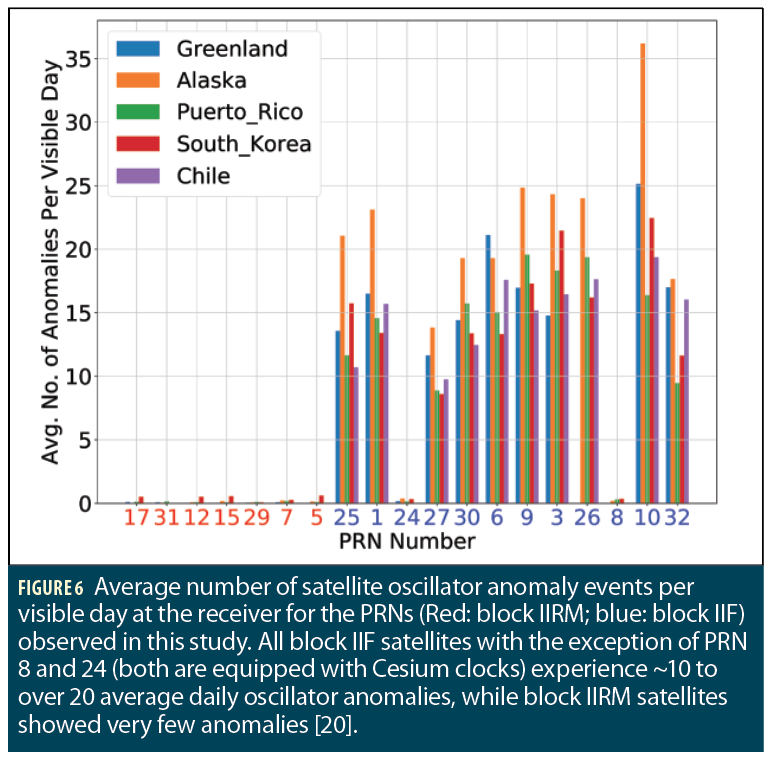
Another interesting observation is the number of oscillator anomalies detected on different satellites. Figure 6 plots the average number of oscillator anomaly events per visible day at the receiver for the PRNs observed in this study. The PRN numbers on the horizontal axis are sorted by launch time (PRN17 is the oldest satellite) and color-coded: red for the block IIRM satellites which transmit dual-frequency signals, and blue for block IIF satellites which transmit triple-frequency signals. The receiver site is also color coded in the plot. The figure shows that all block IIF satellites with the exception of PRN 8 and 24 experience somewhere from 10 to more than 20 average daily oscillator anomalies, while block IIRM satellites showed very few anomalies. It is interesting to note that for block IIF satellites, PRN 8 and 24 are equipped with Cesium clocks while the others have Rubidium clocks.
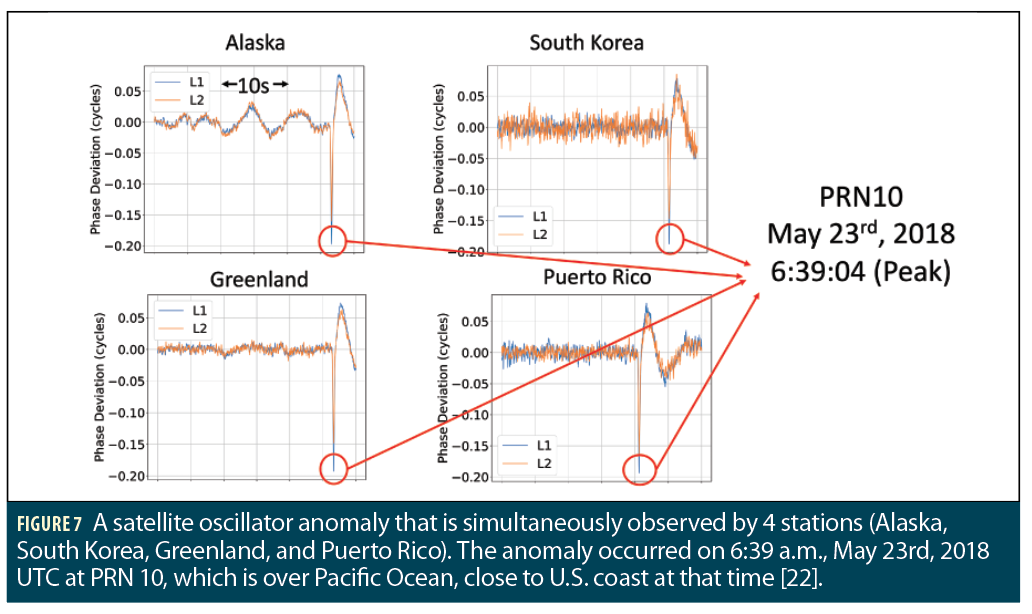
We should point out that careful validation of the detected oscillator anomalies was done prior to the statistical analysis. The validation is performed by comparing the detected event anomaly patterns from multiple receivers having a common view of the same satellite. Figure 7 shows an example of a satellite oscillator anomaly event that is simultaneously observed by 4 stations. It is clear that the anomaly observations from 4 stations occur at the same time with a similar shape. The time series characterizations of the detected anomaly events for individual satellites are under investigation to develop a model that captures the anomalies. Such models can be helpful in characterizing the nature of the anomaly which may ultimately lead to corrective procedures or forecasting of the anomaly occurrence.

Summary
The ML-based satellite oscillator anomaly detection method can automatically and accurately detect satellite oscillator anomalies using a single receiver. This enables the possibility of deploying this method on a worldwide GNSS monitoring network to characterize the occurrence of satellite oscillator anomalies for each satellite.
This work is supported by a contract from Lockheed Martin. The authors appreciate the suggestions and edits offered by Ian Collett.
References
(1) N. Vary, “DR#110: PRN4 Carrier Phase Anomalies Cause WAAS SV Alerts.” WAAS Technical Memorandum, Federal Aviation Administration WJHTC, Atlantic City International Airport, NJ, Oct. 17, 2012, [Online]. Available: http://www.nstb.tc.faa.gov/DisplayDiscrepancyReport.htm.
(2) M. Weiss, P. Shome, and R. Beard, “On-Board GPS Clock Monitoring for Signal Integrity,” in Proceedings of 38th Annual Precise Time and Time Interval Meeting, Reston, Virginia, Nov. 2010, pp. 465–480.
(3) J. Blanch et al., “Critical Elements for a Multi-Constellation Advanced RAIM: Critical Elements for Multi-Constellation ARAIM,” Journal of Institute of Navigation, vol. 60, no. 1, pp. 53–69, Mar. 2013, doi: 10.1002/navi.29.
(4) T. Walter, P. Enge, and B. DeCleene, “Integrity Lessons from the WAAS Integrity Performance Panel (WIPP),” in Proceedings of the 2003 National Technical Meeting of The Institute of Navigation, Anaheim, CA, Jan. 2003, pp. 183–194.
(5) T. Walter, J. Blanch, R. E. Phelts, and P. Enge, “Evolving WAAS to Serve L1/L5 Users,” Journal of Institute of Navigation, vol. 59, no. 4, pp. 317–327, 2012.
(6) H. S. Cobb et al., “Observed GPS Signal Continuity Interruptions,” in Proceedings of the 8th International Technical Meeting of the Satellite Division of The Institute of Navigation (ION GPS 1995), Palm Springs, CA, 1995, vol. 8, pp. 793–795.
(7) Y. Liu and Y. Morton, “Automatic Detection of Ionospheric Scintillation like GNSS Oscillator Anomaly Using a Machine Learning Algorithm,” in Proceedings of the 32nd International Technical Meeting of the Satellite Division of The Institute of Navigation (ION GNSS+ 2019), Miami, Florida, Sep. 2019, pp. 3390–3400.
(8) Y. Liu and J. Morton, “Machine learning based Automatic Detection of Ionospheric Scintillation-like GNSS Oscillator Anomaly Using Dual Frequency Signals,” in Proceedings of the 51st Annual Precise Time and Time Interval Systems and Applications Meeting, San Diego, California, Jan. 2020, pp. 366–373, doi: 10.33012/2020.17311.
(9) Y. Liu and J. Morton, “Automatic Detection of Ionospheric Scintillation-like GNSS Satellite Oscillator Anomaly Using a Machine Learning Algorithm,” Journal of Institute of Navigation, vol. 67, no. 3, pp. 651–662, 2020, doi: https://doi.org/10.1002/navi.385.
(10) S. Gordon, K. Shallberg, S. Ericson, J. Grabowski, T. Morrissey, and F. Lorge, “PRN#21 Carrier Phase Perturbations Observed by WAAS,” in Proceedings of the 22nd International Technical Meeting of the Satellite Division of The Institute of Navigation (ION GNSS 2009), Savannah, GA, Sep. 2009, pp. 1236–1243.
(11) L. Heng, “Safe Satellite Navigation With Multiple Constellations: Global Monitoring Of GPS And GLONASS Signal-In-Space Anomalies,” Doctoral Dissertation, Stanford University.
(12) “Lockheed Martin—GPS III Satellites.” https://www.lockheedmartin.com/en-us/products/gps.html?gclid=CjwKCAiA25v_BRBNEiwAZb4-ZdaLrnDBXuuvqP-PNQYJvh9xfT4Ge3deCyjz-xrLcDXjuwg3LTl3jBoCzzEQAvD_BwE.
(13) Y. J. Heo and J. Cho, “An Approach for GPS Clock Jump Detection Using Carrier Phase Measurements in Real-Time,” Journal of Electrical Engineering & Technology, vol. 7, no. 3, pp. 429–435, 2012.
(14) C. J. Benton and C. N. Mitchell, “GPS satellite oscillator faults mimicking ionospheric phase scintillation,” GPS Solutions, vol. 16, no. 4, pp. 477–482, Oct. 2012, doi: 10.1007/s10291-011-0247-3.
(15) C. J. Benton and C. N. Mitchell, “Further observations of GPS satellite oscillator anomalies mimicking ionospheric phase scintillation,” GPS Solutions, vol. 18, no. 3, pp. 387–391, Jul. 2014, doi: 10.1007/s10291-013-0338-4.
(16) Y. Morton, B. Breitsch, Z. Yang, H. Borne, D. Xu, and C. Rino, Chapter 31: Ionospheric Effects, Monitoring, and Mitigation Techniques, in Position, Navigation, and Timing Technologies in the 21st Century, Volume 1 and 2, 2 vols. Wiley-IEEE Press, 2020.
(17) R. K. H. Ramesh, S. Ugazio, and F. van Graas, “Keynote: Characterization of GPS Satellite Anomalies for SVN 63 (PRN 1) Using a Dish Antenna,” in Proceedings of the ION 2017 Pacific PNT Meeting, Honolulu, Hawaii, May 2017, pp. 167–182, doi: 10.33012/2017.15081.
(18) A. Hansen, T. Walter, D. Lawrence, and P. Enge, “GPS Satellite Clock Event on SVN 27 and Its Impact on Augmented Navigation Systems,” in Proceedings of the 11th International Technical Meeting of the Satellite Division of The Institute of Navigation (ION GPS 1998), Nashville, TN, Sep. 1998, pp. 1665–1673.
(19) C. Rino, The Theory of Scintillation with Applications in Remote Sensing. Wiley-IEEE Press, 2011.
(20) Y. Liu and Y. J. Morton, “Improved Automatic Detection of GPS Satellite Oscillator Anomaly using A Machine Learning Algorithm,” in Proceedings of the 33rd International Technical Meeting of the Satellite Division of The Institute of Navigation (ION GNSS+ 2020), Sep. 2020, pp. 3567–3580.
(21) Jiao, Y., J. Hall, Y. Morton, “Performance evaluation of an automatic GPS ionospheric phase scintillation detector using a machine-learning algorithm,” Navigation, J. Institute of Navigation, 64(3):391-402, DOI:10.1002/navi.188, Summer 2017
(22) Liu, Y., Y. J. Morton, “Improved automatic detection of GPS satellite oscillator anomaly using a machine learning algorithm,” Under review, Navigation, J. of Institute of Navigation, 2021.
Authors

Yunxiang Liu is a doctoral candidate in Ann and H.J. Smead Aerospace Engineering Sciences at the University of Colorado, Boulder. He received an M.E. Degree from Nanyang Technological University, Singapore.

Y. Jade Morton is an Aerospace Engineering Professor, Thomas F. Austin Faculty Fellow, and Director of the Colorado Center for Astrodynamics Research at the University of Colorado, Boulder. She received a Ph.D. in Electrical Engineering (EE) from Penn State. She is a recipient of the IEEE Kershner Award, the Institute of Navigation’s (ION) Burka, Thurlow, and Kepler Awards, and is a Fellow of the ION, RIN and the IEEE.


