Identifying multipath reflectors for validating ray tracing in urban canyons.
PENG XIE, OPENLOOPNAV INC.
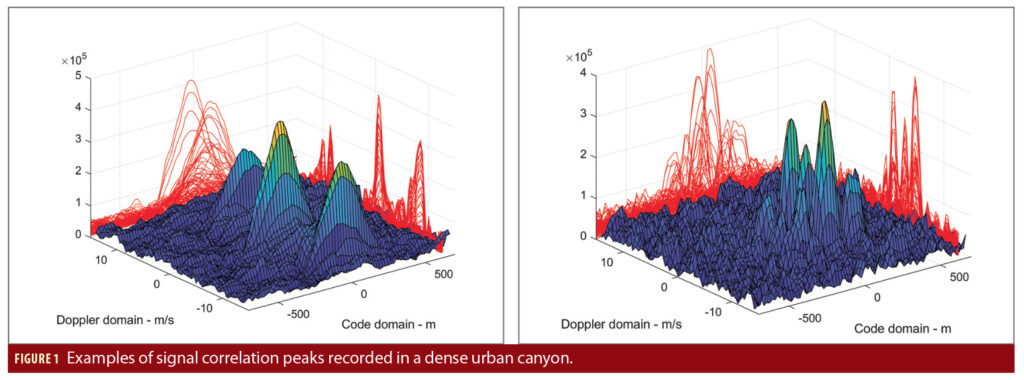
Global Navigation Satellite Systems (GNSS) have been widely used in many applications. Multipath mitigation in urban canyons is one of the last unsolved problems in GNSS as discussed in [1]. A large number of multipath signals can be observed in dense urban canyons such as downtown San Francisco. The receiver can be surrounded by many tall buildings, causing signals to bounce around among different buildings. Multipath causes the presence of several correlation peaks, which are computed by the receiver for estimating the signal parameters.
Clear examples are shown in Figure 1, where at least three correlation peaks are observed for a GPS satellite (left) and at least four correlation peaks for a Galileo satellite (right) with different delays and Doppler frequencies. Each peak corresponds to a signal component, either line-of-sight (LOS) or multipath. The red curves are the projections of the correlation peaks in the code and Doppler domain, respectively.
Shadow matching and 3D ray tracing techniques were proposed recently to improve position performance in urban canyons. Shadow matching uses a 3D city model to find the most likely user location by comparing received signal power and predicted satellite visibility [2-4 ]. Ray tracing is a technique that uses 3D city and digital elevation models to determine reflection points of GNSS signals between a given satellite and receiver position [1, 5].
The relationship between multipath occurrence and reflector size is analyzed by using the Fresnel zone concept. By determining possible reflection points on the reflecting surfaces, reflected signal amplitudes and ranges can be identified from a geometrical perspective [6]. The ray tracing technique works based on
several assumptions, e.g., shape of reflector, smoothness of the reflector, materials, specular reflection or diffraction, etc. Usually, only a single reflection is assumed. In [5], Strandjord experimentally showed that, using current smartphones, it is not possible to establish whether the signals tracked are LOS or non-line of sight (NLOS) components. Note that in this context we classify both NLOS reception and multipath reception as multipath, even though the receiver may be affected differently by NLOS and multipath [3,4].
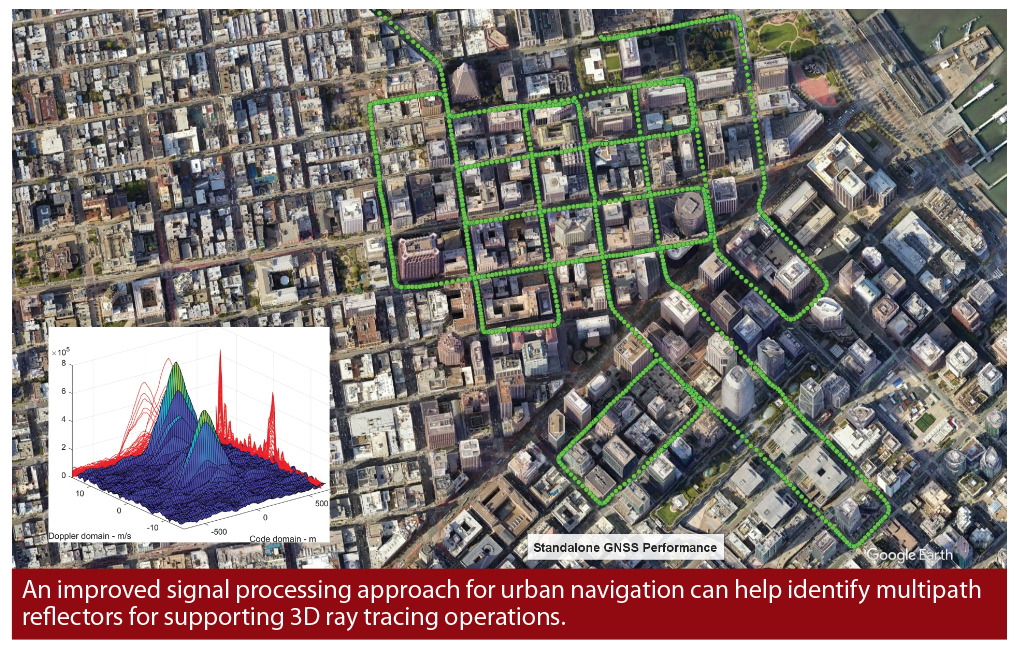
Determining how to evaluate ray tracing performance and validate assumptions used in ray tracing is still a challenge. Conventional methods reported in literature to evaluate ray tracing performance are based on signal power, range and Doppler errors [7]. In [8], Zhang et al. used single/double difference to evaluate ray tracing performance. Each method has its own limitations and often external aiding information is required. In this work, a standalone GNSS solution is proposed to better isolate signals observed in urban canyons. By isolating the LOS from multipath signals, accurate position solutions can be obtained in challenging environments such as downtown San Francisco. While the technique can be used for accurate navigation, it also provides an effective tool to assess the quality of ray tracing results.
A software receiver was designed for this purpose, and a digital front-end has been used to collect Radio Frequency (RF) data. In our architecture, a correlation map similar to the one shown in Figure 1 is available for every satellite at each epoch, meaning we have the ability to detect several rays at the same time. We use advanced signal processing and position estimation techniques to characterize each ray tracked. By using L1 signals (GPS L1, Galileo E1 and Beidou B1C), everything is resolved in the position engine, which features a Kalman filter architecture. Range errors of each ray are directly available and can be used to detect the reflectors causing multipath.
Doppler Frequency
Doppler frequency is the signal frequency change from satellite to receiver due to relative motion between them. The Doppler frequency perceived by the receiver is comprised of contributions from satellite motion, receiver motion and receiver clock effects. LOS signal Doppler can be written as

where is the satellite velocity vector,
is the receiver velocity vector,
is the unit LOS vector, dR is the receiver clock drift, and λ is the signal wavelength. Similarly, multipath signal Doppler can be written as

where is the multipath unit vector.
Previous research showed that for dynamic scenarios, LOS and multipath signal generally have different Doppler frequencies [9, 10]. Multipath Doppler difference can be written as

In a 2D scenario, if we know the multipath Doppler error, df, receiver velocity, , and LOS vector,
, we can obtain the angle θ between
and
, which is the multipath direction:

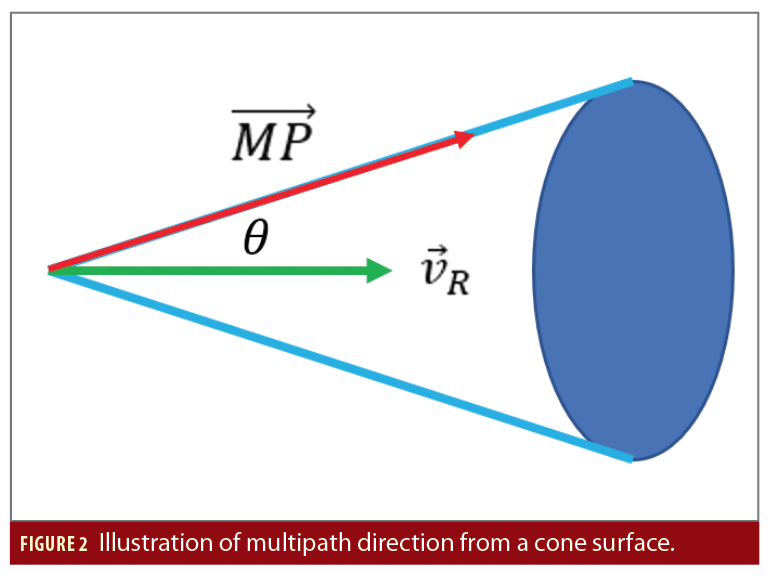
However, θ is a combination of elevation and azimuth in a 3D coordinate system, so the multipath vector could be anywhere on a cone surface as shown in Figure 2. If we assume multipath elevation is the same as LOS elevation, the multipath azimuth ambiguity can be reduced to two values, i.e., left side and right side on the cone surface with the same elevation.
Ray Tracing and Fresnel Zone
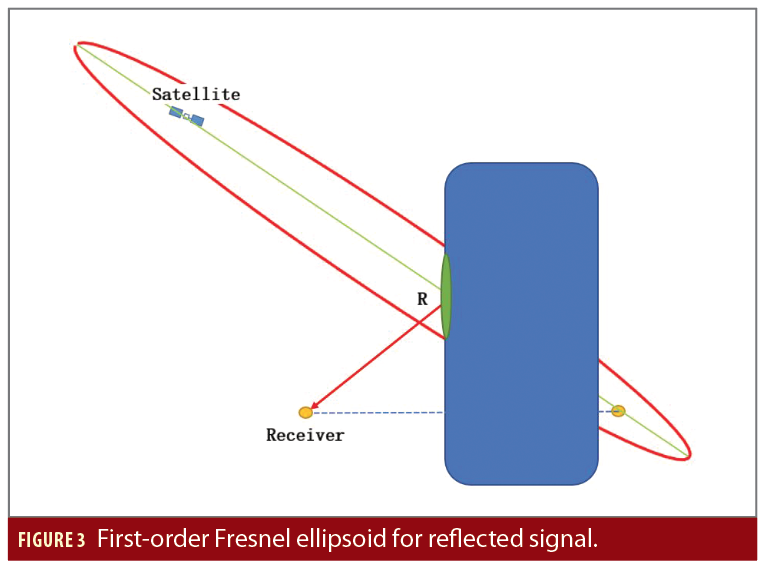
Ray tracing is commonly used in computer graphics for image synthesis. The light propagation path from its source is traced as it bounces multiple times around the scene. In this work, ray tracing refers to an approach that uses a 3D city model to analyze the signal path between a given satellite and the receiver position. By determining the reflection points on the obstruction surfaces, possible reflected paths can be identified. In the case of reflection, there are many areas on the obstructing surface that contribute to the reflected signal. Those regions are named Fresnel zones [6]. The Fresnel ellipsoid of the first-order has the most energy transmitted; in this regard, the first-order Fresnel zone is used to decide if reflection is significant enough to affect a receiver.
As shown in Figure 3, the Fresnel zone is overlapped with the 3D building model, where satellite position is a focal point of the ellipsoid. In the figure, the small yellow circle on the left side of the blue building represents the receiver, whereas the yellow circle on the right side represents the mirror of the receiver onto the reflector plane (another focal point of the ellipsoid). R is the reflection point. Usually, if the overlapping is more than 50% of the Fresnel zone, it is assumed that the reflected signal will affect receiver performance [5,6].
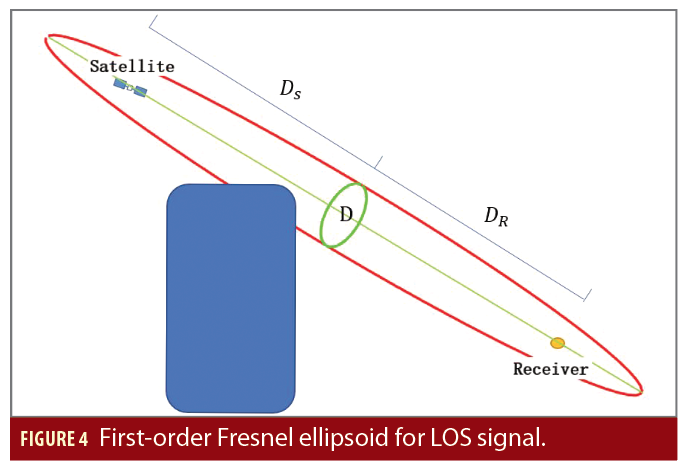
A similar idea can be applied to LOS propagation. LOS Fresnel zone is defined in Figure 4 and closely following the detailed description documented in [11], the radius Rf of the Fresnel zone at any point along the path is given by:
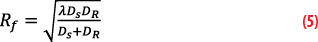
where Ds is the distance between satellite and point D, and DR is the distance between receiver and point D. LOS signal power is decided by this Fresnel zone. If there is no obstruction between
satellite and receiver, we will get a nice correlation peak. However, if some obstructions are present on the propagation path and overlap with the Fresnel zone, the LOS signal will be diffracted at the edges of the object; consequently, the LOS power will be attenuated.
The power of LOS and multipath can change quickly during a short period of time in urban canyons, especially for driving scenarios. This depends on the overlap between the Fresnel zone and obstructions.
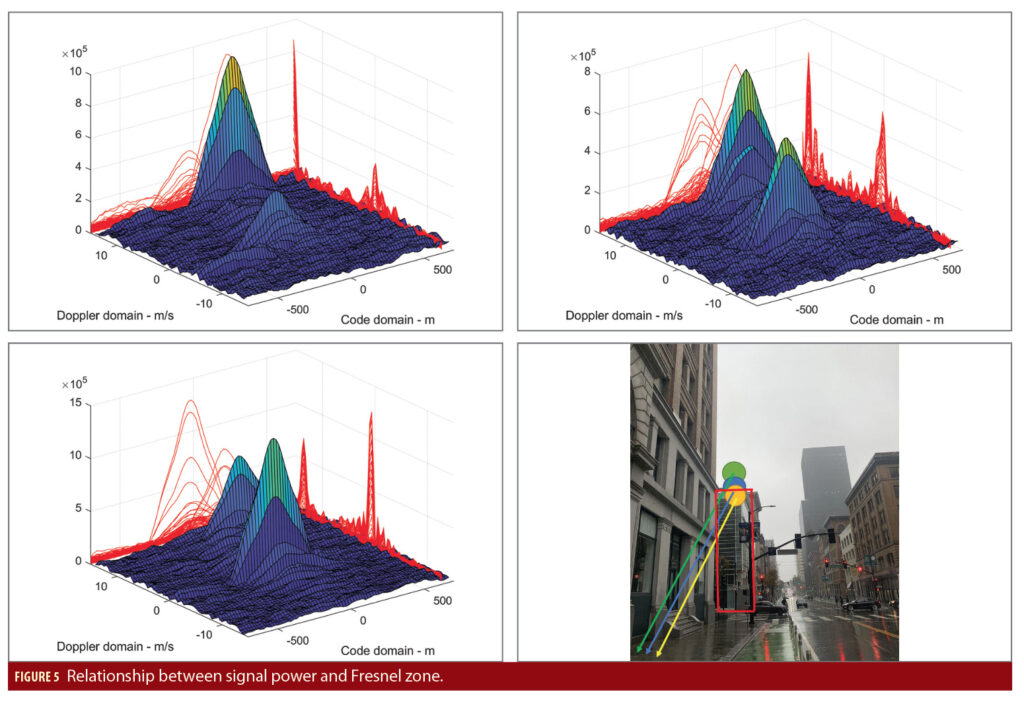
An illustration of this phenomenon is shown in Figure 5 downtown San Francisco. A LOS peak and a strong multipath peak can be observed for GPS Satellite Vehicle (SV) 8 with 41 degrees elevation, 118 degrees azimuth. Correlation plots are shown for three consecutive seconds in Figure 5: the building highlighted in the red rectangle can partially block the LOS signal. On the top left plot of the figure, the LOS peak (in the middle) is weaker compared to the multipath (peak on the far left side); after one second (top right plot), the LOS peak (in the middle) is much stronger compared to one second earlier.
The LOS power variation during these consecutive two seconds is due to the Fresnel zone discussed earlier, which is also shown in the bottom right plot, where the overlapping between LOS Fresnel zone and the obstruction is changing rapidly. The yellow circle corresponds to the top left plot, with more than 70% of the Fresnel zone overlapped with the building, which is why the LOS signal is very weak; the blue circle corresponds to the top right plot, with less than 50% of Fresnel zone overlapped with the building, thus, the LOS signal is stronger compared to the previous second. Finally, the green circle corresponds to the bottom left plot, where there is no overlap between the Fresnel zone and the building. Thus, a strong LOS peak can be observed.
A commercial receiver may track the overlapped version of correlation peaks, depending on how the receiver is designed.
Reflector Direction Prediction
Using the approach developed we can tell from which direction the multipath component is originating. This section discusses how to calculate the reflector direction based on several assumptions when the receiver is moving. This can be used to evaluate ray tracing performance in several ways to answer the following questions:
• Is multipath direction and signal power observed the same as the ray tracing prediction?
• Is range error and/or Doppler error observed the same as the ray tracing prediction?
• Is the ray number observed the same as the ray tracing prediction?
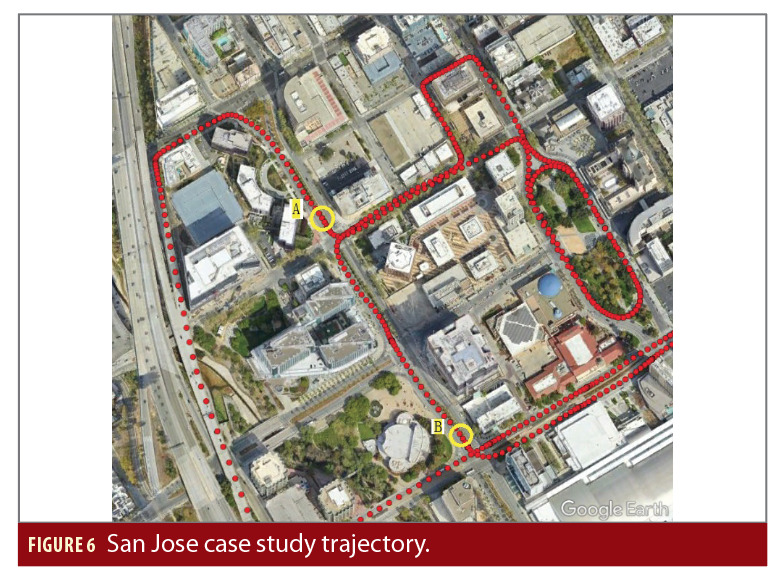
To demonstrate these points, we collected data from the city of San Jose. Red dots in Figure 6 show the field test route. We selected two locations (A and B) to study how to predict reflector direction from our solution.
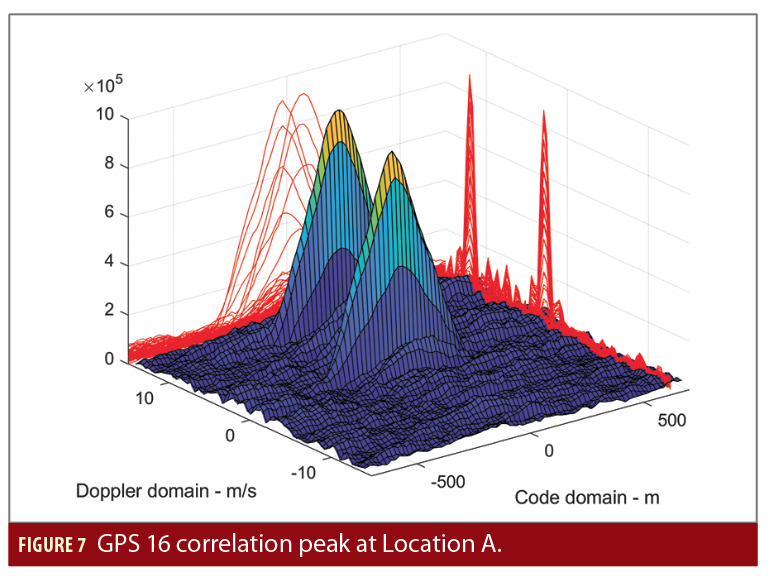
GPS SV 16 is used in this study, elevation is 27.7 degrees, and azimuth is 288.7 degrees. Receiver position at location A is [37.332472 -121.893792], and speed is 6.6 m/s. Figure 7 shows GPS SV 16 L1 signal correlation peaks at location A.
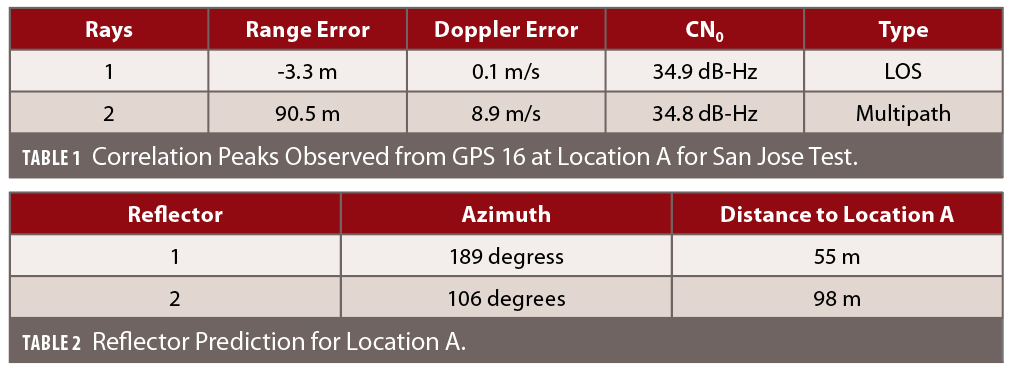
Table 1 summarizes the correlation peaks shown in Figure 7.
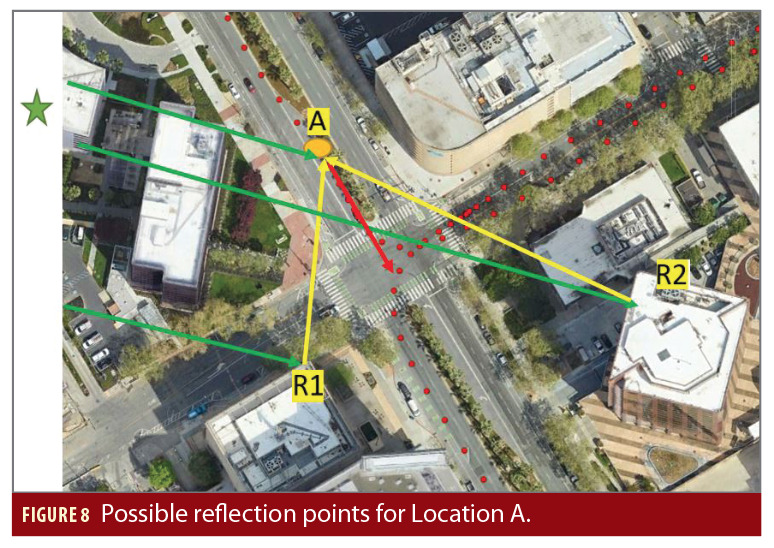
From Equation 4, we can get θ is 48.5 degrees for ray 2, which is a multipath with 8.9 m/s Doppler error (i.e., df=8.9). If we assume it is a specular reflection and multipath elevation is also 27.7 degrees (the same as LOS), we can obtain two azimuths of multipath direction (106 degrees and 189 degrees), these two directions are on the same cone surface as depicted in Figure 2. Now we can do a simple ray tracing based on Google Earth to evaluate our prediction. From Google Earth two possible reflection points, R1 (azimuth 189 degrees) and R2 (azimuth 106 degrees), can be identified as shown in Figure 8. Green arrows are LOS vectors, yellow arrows are multipath vectors and the red arrow is velocity vector. Reflector information is summarized in Table 2.
After calculating the geometry range from point R1 and R2 to location A separately, we conclude that point R1 should be the correct reflector. The extra path from reflector R1 is 91 m, which matches the range error shown in Table 1 (91 m versus 90.5 m). This confirms our reflector direction prediction is reliable, i.e., we can actually find a valid reflector from this direction.
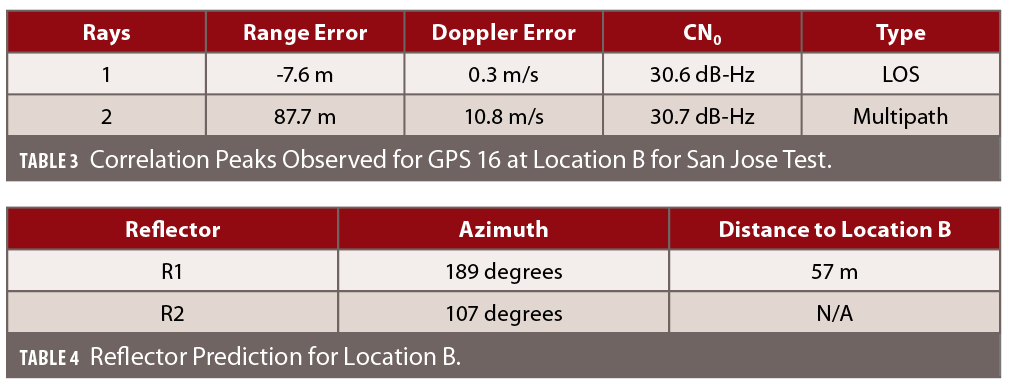
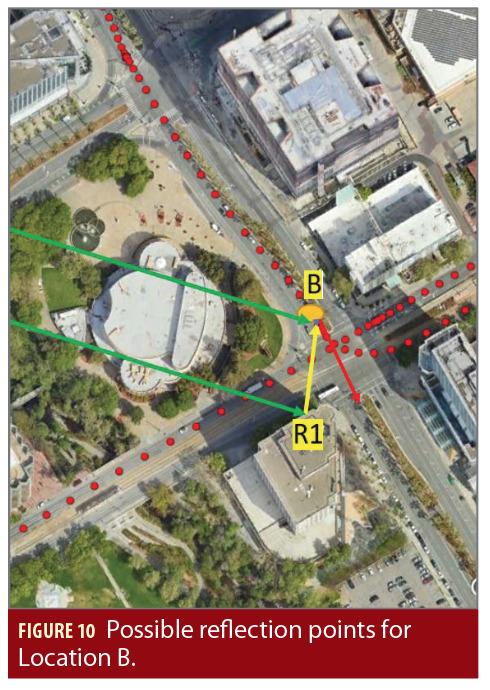
After 400 s, a similar multipath peak showed up at location B as depicted in Figure 9. Receiver position at location B is [37.329719 -121.891592], and receiver speed is 8.0 m/s. Table 3 summarizes correlation peaks observed from this figure. Again, two possible multipath azimuths can be obtained in Table 4, i.e., 189 degrees and 107 degrees. From Google Earth only one possible reflection point R1 (azimuth 189 degrees) can be identified as shown in Figure 10; no valid reflection point can be observed from 107 degrees.
After calculating the geometry range from point R1 to location B, we conclude that point R1 should be the correct reflector. The extra path from reflector R1 is 94 m, which matches the range error shown in Table 3 (94 m vs. 87.7m).
From the case studies, we learned the solution we proposed in this work to evaluate ray tracing performance is accurate and reliable. Moreover, if the L5 signal is used, the range accuracy can be further improved as the L5 signal has higher range resolution.
Conclusion
In summary, we proposed a solution that can be used to evaluate ray tracing performance in urban canyons, which takes advantage of multipath Doppler behavior under dynamics. The solution we proposed is a standalone system without any aiding information used; moreover, it works in a reverse way to ray tracing, i.e., we don’t do ray tracing, but we can tell which ray is observed in the receiver, and the possible direction of each ray. The Fresnel zone concept is illustrated in this work, and can be used to evaluate assumptions made in ray tracing, e.g., building model, material permittivity, etc., which will affect the received signal amplitude in the receiver side. Two case studies in San Jose are conducted to verify our method, with results showing our solution is accurate and reliable to evaluate ray tracing performance.

Manufacturers
The digital front-end used in the experimental analysis is a Universal Software Radio Peripheral (USRP) B200mini from Ettus Research.
References
(1) Van Diggelen, F., “End Game for Urban GNSS: Google’s Use of 3D Building Models”. Inside GNSS Magazine, March 2021
(2) Wang, L., Groves, P., and Ziebart, M., “GNSS shadow matching: Improving urban positioning accuracy using a 3D city model with optimized visibility prediction scoring”. In Proceedings of the 25th ITM of the Satellite Division of The Institute of Navigation (ION GNSS 2012), pp. 423–437
(3) Groves, P., “Multipath vs. NLOS Signals”. Inside GNSS magazine, November 2013
(4) Groves, P., “Shadow matching: A new GNSS positioning technique for urban canyons”. The Journal of Navigation. 2011, 64(3), 417– 430. https://doi.org/10.1017/S0373463311000087
(5) Strandjord, K. L., Axelrad, P., Mohiuddin, S., “Improved urban navigation with shadow matching and specular matching”. NAVIGATION. 2020;67: 547–565. https://doi.org/10.1002/navi.378
(6) Zimmermann, F., Schmitz, B., Klingbeil, L., and Kuhlmann, H., “GPS multipath analysis using fresnel zones”. Sensors. 2018, 19(1), 25. https://doi.org/10.3390/s19010025
(7) Panicciari, T., Soliman, M. A., Moura, G., “Simulating multipath in real time for receiver evaluation”, GPS World, March 2018
(8) Zhang, G., Xu, B., Ng, H.F., Hsu, L.T.,“GNSS RUMS: GNSS Realistic Urban Multiagent Simulator for Collaborative Positioning Research”. Remote Sens. 2021, 13, 544. https://doi.org/10.3390/rs13040544
(9) O´Driscoll, C., Lachapelle, G., and Tamazin, M., “Dynamic Duo: Combined GPS/GLONASS Receivers in Urban Environments”, GPS World, January, 2011
(10) Xie, P., Petovello, M. G., and Basnayake, C., “Multipath Signal Assessment in the High Sensitivity Receivers for Vehicular Applications”, Proceedings of ION/GNSS 2011, September 18-22, Portland, OR
(11) Hannah, B., “Modelling and Simulation of GPS Multipath Propagation”, PhD Thesis, Queensland University of Technology, 2001
Author
Peng Xie co-founded OpenLoopNav Inc. Before that, he worked for Samsung and Intel for GNSS receiver design. He received B.S. and M.S. degrees in aerospace engineering from the Beijing Institute of Technology, China, and a Ph.D. from the Department of Geomatics Engineering, University of Calgary, Canada. His current interests include GNSS software receiver design, multipath mitigation and inertial navigation.


