
A look at a multiscale interference monitoring approach using several different detectors, as well as an overview of findings of an interference monitoring campaign conducted at a European airport.
by Sascha Bartl, Manuel Kadletz, Philipp Berglez, Tomáš Duša
Global navigation satellite systems (GNSS) have become increasingly important in many different fields of application, including the aeronautical domain. With the growing dependency on GNSS for various safety-critical applications, both the threat of intentional signal disturbances and the number of reported incidents of jamming are increasing. Even spoofing attacks, which were long thought of as a theoretical threat requiring high effort and knowledge, can today be conducted using relatively cheap software-defined radios (SDRs) and open-source software.
Aeronautics depends on GNSS in several ways, including in-flight navigation, ground-based augmentation systems (GBAS) and surveillance. Recent publications have shown vulnerabilities of GNSS systems against jamming and spoofing and demonstrated that receiver autonomous integrity monitoring (RAIM), which is widely used in aviation, provides limited defense against intentional interference [1,2]. Therefore, there’s a need for the development, evaluation and use of dedicated interference monitoring algorithms, targeting jamming and spoofing, that are applicable to the most vulnerable phases of flight (i.e. approach and landing).
While on-board interference detection and mitigation is considered important for the long-term evolution of GNSS in aviation, both commercial and general, the approach presented here uses a ground-based monitoring station to detect interference and issue a warning to the users. When deployed in the vicinity of an airport, such a system can secure GNSS during approach and landing, which is critical. The ground-based design can be mounted at a fixed location, can be more power consuming and is less restricted by long-term certification requirements for aviation equipment.
Background
GNSS signals are susceptible to intentional interference without requiring very high signal power or overly complex equipment. This has been widely reported in literature, gaining public interest in 2001 with the Volpe report [3], which assessed the dependencies of the transportation infrastructure on GPS and the vulnerabilities to signal interference. The two main factors contributing to the vulnerability of GNSS signals against interference are the low received signal power (below thermal noise) and the open and publicly known signal structure. Although modernized signals counter the vulnerabilities by employing more sophisticated modulation schemes like higher-order binary offset carrier (BOC) or authentication features, these countermeasures cannot provide perfect interference mitigation. Many systems also still rely on older signals.
Signal Model
To counter the threat of intentional interference, it is important to understand GNSS signal structure. Therefore, a basic signal model used throughout the development of the detection algorithms is presented here. The equations are derived from [4].
According to [4], a radio frequency (RF) signal xRF(t) can be written
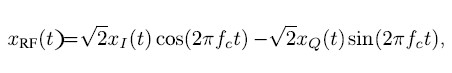
as a function of time t at a certain carrier frequency fc, with the in-phase I and quadrature-phase Q components xI (t) and xQ(t). These two components are orthogonal to each other and share the same power normalization factor of √ 2. The 90° phase delay of the quadrature component leads to the signals being right-handed circularly polarized (RHCP).
GNSS uses both the I and Q components of the baseband signal to transmit more than one navigational signal on the same carrier wave, which is generally known as quadrature phase shift keying (QPSK). In this modulation scheme, each component is spread across a certain bandwidth by using binary phase shift keying (BPSK) or BOC modulation. For actual transmission of information to the receiver, a navigation message D(t) [1; 1] (at signal level) is introduced in addition, leading to a single signal component y(t) reading
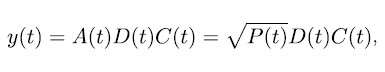
where P(t) denotes the power of the signal component, A(t) is the amplitude and C(t) is the binary spreading sequence or pseudorandom noise (PRN) code. Inserting (2) into (1) yields
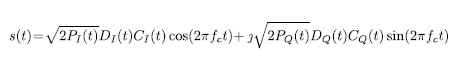
as generic model of a typical GNSS signal as transmitted by a satellite. The received signal of a single satellite on Earth can be expressed as
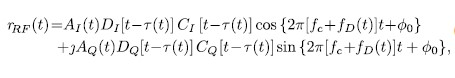
where (t) denotes the code delay, 0 is the phase delay and fD(t) denotes the Doppler frequency shift due to the relative motion between satellite and receiver. The overall signal received contains the signals of all satellites in view as well as thermal noise and can thus be expressed (using the trigonometric identity as shown in [4]) as
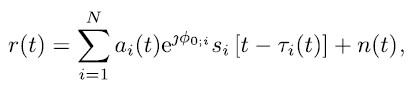
with si being the signal from satellite i attenuated by ai(t), N denoting the number of satellites in view and n(t) being additive white Gaussian noise (AWGN).
Intentional Interference
GNSS interference can be unintentional (e.g., inter-system interference, multipath, etc.) or intentional. Unintentional interference generally can be better controlled and mitigated [5–7] and is not the primary focus of this work. Intentional interference is categorized into the two main categories, jamming and spoofing, which pose a significant risk to GNSS measurements. Jamming denotes the transmission of high-powered signals with the goal to shadow the GNSS signals so a receiver cannot acquire and track them. Typical jamming signals are chirp or noise signals with a bandwidth matching or exceeding the bandwidth of the respective GNSS bands they target.
A good overview of available civil jamming devices and their signal characteristics is presented in [8]. The signal model presented in (5) in case of jamming is extended as
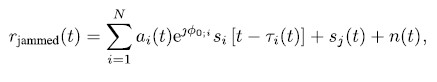
with sj(t) denoting the jamming signal. As mentioned, the actual waveform of this jamming signal is not primarily important. Any interference signal leads to a decrease in carrier-to-noise ratio (C/N0) of the received satellite signals, which, if the decrease is high enough, leads to the inability of acquisition and tracking.
Spoofing denotes the transmission of fake GNSS signals with the goal to falsify (spoof) the position, velocity and time (PVT) solution of the receiver under attack. For this, spoofing signals have to be modulated in the same way authentic satellites are modulated. The navigation messages also usually have to be mimicked for a spoofing attack to work well. Typical spoofing attacks rely on either a GNSS signal generator or a modified (usually software-defined) GNSS receiver [9]. The signal model in case of spoofing is extended to
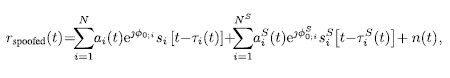
where the superscript S denotes a spoofing signal. The spoofing signals’ code delay as received not only depends on the actual and spoofed position but also on the spoofer’s synchronization error. This contains the error in time synchronization relative to the GNSS time as well as the error in the estimation of the victim receivers’ position, which is crucial for successful spoofing attacks.
GNSS Interference in Aeronautics
Interference has multiple potential impacts on aircraft systems. The most common impact is the complete loss of GNSS reception, which results in loss of position, navigation and time (PNT). However, given the variety of systems operating, the impacts will not be homogenous across all fleets and equipage. In some cases, the GNSS signal could be degraded but not completely lost, resulting in decreased position accuracy.
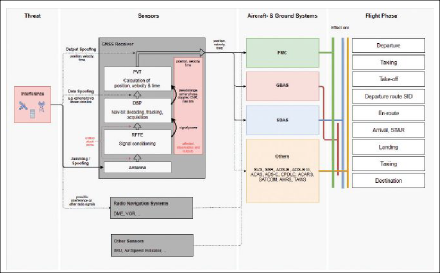
The aircraft receiver is the main source of position information, which drives the aircraft navigation system supporting required navigation performance (RNP) operations and providing position input to different aircraft systems. Some business aircraft even use GNSS as a reference source for aircraft flight control and stability systems [10]. GNSS interference, either intentional or unintentional, introduces a threat to the navigation equipment via different vectors. A wide variety of aircraft and ground systems rely on proper GNSS service and thus have to be assessed in terms of the effects of a malfunctioning service affecting different flight phases. Figure 1 gives a holistic overview of the impacts of a jamming/spoofing attack.
Development of a Multiscale Interference Monitoring Algorithm
The effect of interference on a GNSS receiver can be recognized within various stages of the signal processing as indicated in Figure 1. Therefore, it is considered vital for reliable interference monitoring to also target all of these stages by combining different detectors within a multiscale approach. This ensures high reliability in terms of high detection probability and low false-alarm rates. During the development, special attention was also paid to the regulatory framework within aviation.
The Regulatory Framework
The FAA’s technical standard orders (TSOs) are used as a basis for qualifying aviation equipment. They are typically short documents that mostly rely on minimum operational performance standards (MOPS) as provided by the radio technical commission for aeronautics (RTCA), but in some cases deviate from those RTCA standards by adding, removing or changing the requirements.
A TSO-authorized part qualifies as an airworthy component. As such, a TSO is a minimum performance standard. When authorized to manufacture a receiver to a TSO standard, this is referred to as a TSO authorization. Current GNSS receivers are approved against one of the following TSOs:
- TSO-C129 (GPS as a supplemental means, last version found in RTCA DO208 [11])
- TSO-C145 (GPS+SBAS sensor feeding an FMS, last version found in RTCA DO229F [12])
- TSO-C146 (standalone GPS+SBAS, last version found in RTCA DO229F [12])
- TSO-C196 (GPS sensor feeding into an FMS, replacement of TSO-C129, last version found in RTCA DO316 [13])
- TSO-C161 (GPS+GBAS, last version found in RTCA DO253C [14])
Jamming Detection
Detecting GNSS jamming has been widely covered in literature [15–18]. In general, jamming detection can be performed pre-correlation or post-correlation, while the most suitable approach depends on the type and possibilities of the receiver in use. Because different detectors have different advantages and disadvantages, as pointed out, [15], an optimal jamming detector should be based on the combination of several detector values.
The approach presented in this article relies on monitoring the power spectral density (PSD), total received power within the band and C/N0 of the tracked satellites. The combination of pre-correlation and post-correlation measures is considered advantageous for a low false-alarm rate, which is important for aviation. Furthermore, the chosen detectors are considered to be certifiable for aeronautics with a reasonable effort.
The Jamming Detectors:
PSD Detector
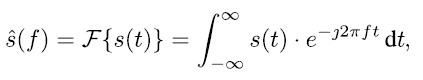
The PSD detector is based on the recorded raw intermediate frequency (IF) signal without further preprocessing within the receiver. Transformation into the frequency domain is performed using Fourier transform as in
while the PSD can generally be computed as
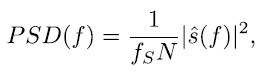
with fS denoting sampling frequency and a sample size N. In the presented approach, the PSD is computed using Welch’s method [19], which is considered optimal because of the smoothing effect. To accurately receive absolute power levels in the PSD, the actual gain of the RF components has to be known/calibrated. For jamming detection, the received PSD can be compared to the expected shape, which is mainly determined by the filter in the radio-frequency front-end (RFFE). The expected power spectrum can easily be estimated as thermal noise combined with the aforementioned filter, because the authentic GNSS signals are actually received below the noise floor.
For the detector presented here, two sets of thresholds above the expected spectrum are defined as follows:
NARROWBAND THRESHOLD: Single peaks within the received PSD are compared to a defined frequency-dependent threshold mask, which can be tailored to the respective filter characteristics or to exclude known tolerated interference signals based on their frequency. The narrowband threshold is considered optimal for detection of narrowband or continuous wave (CW) interference.
WIDEBAND THRESHOLD: The received PSD is averaged over defined frequency bins to form multiple sub-band power levels, which in turn are compared to a dedicated frequency-dependent threshold mask. The wideband threshold is considered optimal for detecting wideband interference. The wideband threshold can be set much lower compared to the narrowband without compromising on false alarm rate because the averaging provides an additional level of smoothing.
For use in aeronautics, these thresholds might be set to the values defined by ICAO as shown in Figure 2.
![FIGURE 2 Threshold mask for interference monitoring (from [20]).](https://insidegnss.com/wp-content/uploads/2022/09/FIGURE-2-Threshold-mask-for-interference-monitoring-from-20..png)
Received Power Detector
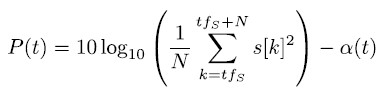
The received power detector measures the absolute received signal power within the monitored frequency band. This is done by computing the power within the digitized signal s[n] and subtracting the actual RF gain (t) as
with N being the number of samples for averaging. Because the GNSS frequency bands are protected, the expected total received power within the band can simply be assumed the thermal noise floor given as
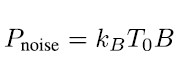
with the Boltzmann constant kB, temperature T0 and bandwidth B. The detector is a simple threshold comparison, which indicates jamming in case the measured power exceeds the expected power plus the defined threshold.
The C/N0 Detector
The effective C/N0 can be used for interference monitoring as post-correlation jamming detector by comparing the actually measured CN0 with an expected value. In general, the effective C/N0 can be written
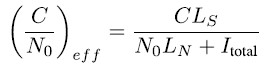
the carrier power C, processing loss in the desired signal LS, noise level N0, processing loss in the noise LN and the total level of interference Itotal. The total interference level can be written
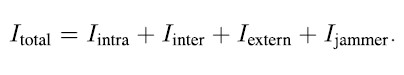
Neglecting the effect of external interference Iextern (which can be seen the same way as jamming signals for the sake of the detector), it can be seen the effect of inter- and intra-system interference should be considered to calculate the expected C/ N0. Inter- and intra-system interference is caused by other GNSS signals (from the same or other constellations) in the same band and can be characterized
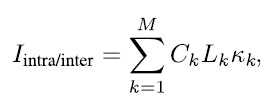
for M signals present at the same time, where Ck denotes the signal power, Lk is the implementation loss for the interference signal and k is the spectral separation coefficient (SSC). The SSC describes the level of interference caused by a certain signal/modulation and can be computed based on the frequency spectra of the respective signals [7].
Jamming detection based on the C/N0 is performed threshold-based per satellite, where the difference between each measured and expected C/N0 is computed as
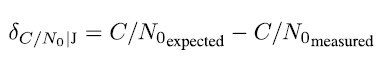
and compared to a pre-defined threshold. This is done for each tracked signal, which leads to a certain percentage of signals indicating jamming. In case this percentage exceeds a defined threshold, a jamming detection is triggered. The approach to summarize the results of all satellites allows for a reasonably low false-alarm rate because an eventual degradation of the C/ N0 for a subset of signals (as for example caused by multipath of partial shadowing) is also expected in cases without jamming.
Combination and Weighting
The three jamming detectors are combined to one final jamming detection decision, which is outlined in Figure 3. The detectors have different weightings, which is a result of an empirical optimization performed using simulations. The final score is either that no jamming can be detected, a warning or an alarm, which can easily be visualized to a user within an operational aviation scenario.
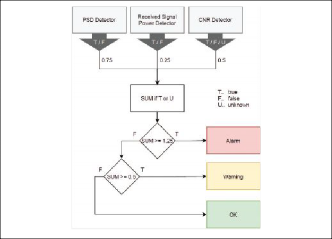
Figure 3 shows the PSD detector has the highest weight followed by the C/N0 and the received power mainly serves as supplementary measure. At least two detectors have to be triggered to issue an alarm. A warning is either triggered by the PSD, C/N0 detector or the combined detection of received power and a second detector. This makes sense because the three detectors are complementary in terms of which signal types (or bandwidths) they can optimally detect. The inclusion (and high weighting) of the C/N0 detector also makes sense as it allows for detection of smart jamming/spectrum-matched jamming signals, which might be undetected by pre-correlation detectors.
Spoofing Detection
Detecting GNSS spoofing is more complex than jamming detection given the different nature of the attack, where a fine-tuned spoofing cannot necessarily be seen in the frequency spectrum. Nevertheless, several spoofing detection algorithms have been published in literature [21–24]. While some spoofing detection algorithms target multiple antennas or are only applicable with relative movement between spoofer and receiver, the approach presented here is suitable for a static single-antenna receiver, which is considered to facilitate eventual certification procedures due to the lower complexity of the overall system.
The Spoofing Detectors:
C/N0 Detector
Spoofing detection based on C/N0 follows the same basic principles as in the jamming explanation. The only difference is the detection metric is inverse compared to the jamming detection as
This is because the expected C/N0 in case of a spoofing attack is higher than authentic, which is required for a successful takeover of the spoofing signal. For details on generation and prerequisites of spoofing attacks, read [25].
Correlation Peak Detector
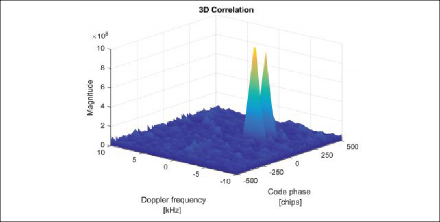
From the spoofed signal model presented in (7) directly follows that the spoofing signals usually cannot remove the authentic GNSS signals from the received signal. Instead, the spoofing signals are added to the overall signal with a (slightly) higher power level. Because of this, the correlation function in case of a spoofing attack shows two correlation peaks instead of one, as is visualized in Figure 4.
The correlation peak detection method is twofold. It monitors for the existence of multiple correlation peaks within the complete code-Doppler search space and for distorted correlation peaks, which is the case when the authentic and spoofing signals partially overlap with each other. Multiple correlation peaks are easily found using a parallel code search FFT-based acquisition algorithm [26] while deliberately removing any already tracked correlation peaks. Monitoring for distorted correlation peaks is done using signal quality monitoring (SQM) metrics in code-delay domain as introduced in [27]. Note the detection of distorted correlation peaks is also common for multipath detection.
Clock Detector
The clock-based spoofing detector operates on the assumption of non-perfect synchronization of the spoofed signals with respect to their authentic counterparts. A GNSS receiver continually estimates its own clock bias relative to the system time within the PVT solution. After receiver initialization, large jumps in the estimated clock bias are typically not expected due to the clock steering algorithm. In case of spoofing takeover, however, such a jump is expected (it is the combined effect of non-perfect time synchronization of the spoofer and nonperfect spoofer as well as victim receiver position estimation).
In an authentic case, the clock bias changes are mainly driven by the clock drift, which is a direct effect of the nonperfect frequency stability of the oscillator. Spoofing signals, however, are also generated using an oscillator as frequency standard, which might show a different clock drift. This results in a change of the observed clock drift after the start of a spoofing attack.
For spoofing detection, the clock bias r(t) and clock drift r(t) at time t are both monitored by predicting the expected values for the next epoch (t + t) as
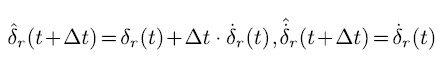
with an estimated variance model of
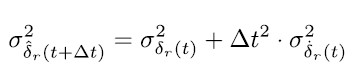
following traditional variance propagation. For the detection, the measured bias and drift are compared with the expected values based on a standard student-t hypothesis test for the mean value, where the mean value is not a priori known.
Note the clock-based detector can only show the beginning of a spoofing attack where the takeover happens. After takeover, the observed clock bias and drift will show the combined clock effect for spoofer and receiver but will again be consistent over time.
Combination and Weighting
The combination of the three spoofing detectors is visualized in Figure 5. After the first stage of detection using the dedicated spoofing detectors, the jamming detectors based on PSD and received power are re-used as secondary spoofing detectors. In case these detectors show a detected jamming event, this is added to the spoofing detection score if at least one of the spoofing detectors was triggered before. Finally, the overall detection score is compared to thresholds again to distinguish between warning or alarm.
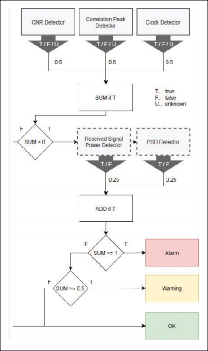
The three detectors are equally weighted for the first stage of detection because they are considered partially complementary to each other. In the case of a high-powered spoofing attack, the difference in signal level between spoofed and authentic signals is also high, which means the difference in C/N0 can be considered significant, while on the other hand the authentic correlation peaks might be drowned in the noise floor due to automatic gain control (AGC) and limited dynamic range. Vice versa, during a well-synchronized and rather low-powered spoofing attack, the effect on the C/N0 might not be significant at all, but multiple peaks or distortions of correlation are better detectable because the power levels of both peaks are comparable. The clock detector can only detect the moment of takeover but works independent of the spoofing power levels (which is especially important for sophisticated spoofing attacks where artificial noise floor is transmitted together with the spoofing signals).
The secondary detection stage is used only after at least one first stage detector was triggered and can increase the detection score. This is justified by the fact spoofing signals are usually more powerful than authentic ones and thus increase the received spectrum and power level.
Monitoring Campaign
The authors had the unique opportunity to install an interference monitoring system for a three-month permanent monitoring campaign in direct vicinity of the airport Brno in Czech Republic. Some findings from this monitoring campaign are presented here.
Installation
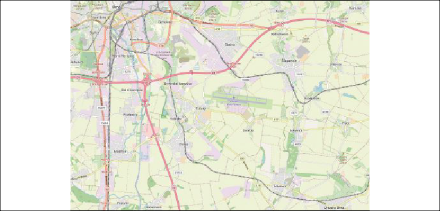
The installation of the monitoring system took place in November 2020 at the location in Figure 6. The monitoring station is near the airport Brno (LKTB) and close to a major highway (D1). The minimum distance between highway and monitoring station is 480m, which is considered small enough for successful detection of most commercial off-the-shelf (COTS) jammers on the highway and is also representative for the airport.
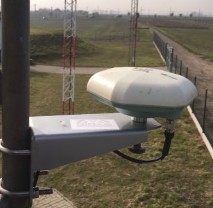
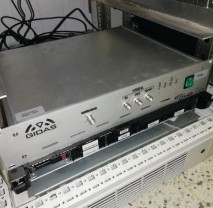
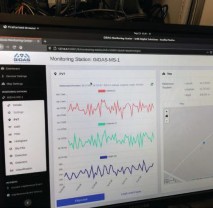
Installation was performed at an airport building, where the antenna could be mounted on a mast and the monitoring system was connected to it via RF cable and could be placed within a 19″ server rack. Figure 7 shows the installation on-site as well as the user interface of the monitoring system, which can be accessed remotely for monitoring purposes. Furthermore, the site has a direct fiber network connection to the airport’s tower building, which was used for data transfer.
Overview of Monitoring Results
The interference monitoring campaign was conducted September 24 to December 20, 2020, resulting in 88 days of signal monitoring. Table 1 provides an overview of the detected interference events. As indicated in the table, the average number of detected events per day was 14.5, which is in line with the authors’ expectations based on literature and monitoring system placement. The two spoofing detections were classified as false alarms and could not be verified using the recorded data (the most likely reason for this is the placement of the antenna beside a mast, which might lead to significant multipath for certain satellites).
| Parameter | Value |
| Monitoring duration | 88 days |
| Total detected interference events | 1,277 |
| Average # events per day | 14.5 |
| Detected jamming events | 1,275 (99.8 %) |
| Detected spoofing events | 2 (probably false alarms) |
| Number of warnings | 856 (67.0 %) |
| Number of alarms | 421 (33.0 %) |
| Average (median) duration of events | 6 seconds |
| Shortest event duration | 2 seconds (minimum reported duration in system) |
| Longest event duration | 249 seconds |
Given the placement of the monitoring system relative to the highway, it is no surprise the majority of interference events were detected for a duration of roughly 6 seconds. We can assume the detection duration and number of detected events would be higher if placed directly beside the highway because the highway is considered the major source of interference at the installation location. Also the proportion of alarms compared to warnings would have been much higher because the effect of interference signals significantly decreases with increasing distance.
Event Examples
The following are examples of recorded interference events to show the visible effect of interference on the monitoring system.
EVENT NO. 30: This event is an example of a wideband interference signal spread across the complete monitored spectrum in the L1/E1 frequency band (Figure 8). The interference signal is clearly visible in the recorded spectrum and above the detection threshold. It also shows a recognizable degradation of C/N0 for all satellites.
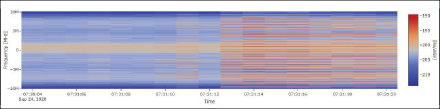
Event Parameters:
START TIME: 2020-09-24 05:31:13 (UTC), duration: 8 seconds
SEVERITY: alarm, classified type: SCW
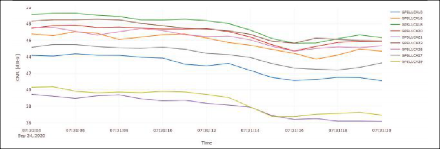
EVENT NO. 4015: This event also shows a wideband interference signal across the complete bandwidth, but with fewer spikes compared to event No. 30 (Figure 9). The effect of interference on the GNSS is higher based on the C/N0 and the fact there are actual tracking (and consequently PVT) losses during the event.
Event Parameters:
START TIME: 2020-10-21 19:24:20 (UTC), duration: 43 seconds
SEVERITY: alarm, classified type: SCW
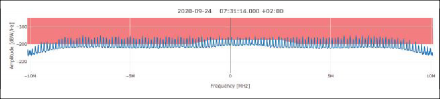
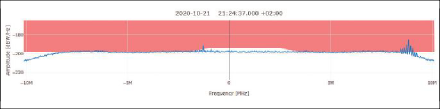
EVENT NO. 4031: This event shows a very interesting narrowband/CW interference signal, located directly on the L1/E1 carrier (Figure 10). Based on the authors’ previous analyses of COTS jammers and their respective signal properties, this interference event is not assumed to be caused by a COTS jammer. Still, the effect of the interference is clearly visible as C/N0 degradation and thus the detection is justified.
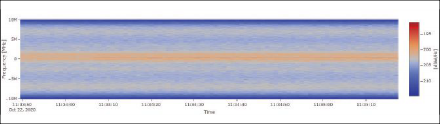
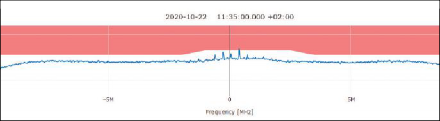
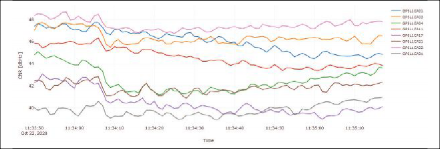
Event Parameters:
START TIME: 2020-10-22 09:34:19 (UTC), duration: 59 seconds
SEVERITY: warning, classified type: CW/ unknown
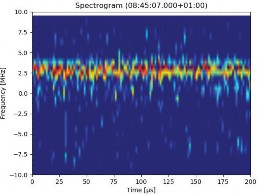
Wide-Area Interference Event
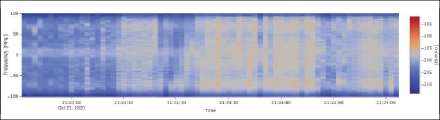
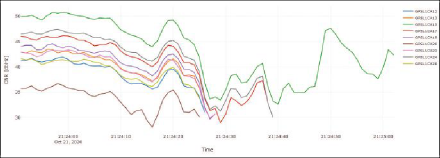
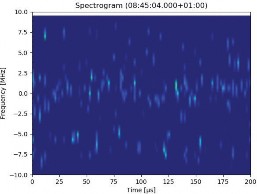
Beside the expected local interference events, the monitoring campaign also showed an interesting series of events on December 10. They were detected not only in Brno but also simultaneously using a different detector (different type and manufacturer) in Prague with a matching spectrum. Thus, the interference had been spread over a significantly wider area, which leads to the assumption it might have been space-based.
Event Parameters:
START TIME: 2020-12-10 07:45:06 (UTC), duration: 6 seconds (multiple times on this day)
SEVERITY: alarm
Figure 11 shows a short time Fourier transform (STFT) computed from the recorded signal snapshots during the event (before the start and during the event). The interference signal is rather narrowband within L1/E1. Further analysis of this specific event is considered of importance and interest, especially because there has been no notification on malfunctions by GNSS providers for this day.
Conclusions and Outlook
This article reviewed the signal model for GNSS signals and intentional interference by means of jamming and spoofing. It presented a multiscale interference monitoring approach based on the combination of several different detectors. Findings of an interference monitoring campaign at the airport Brno also have been presented.
The number and severity of detected interference events clearly shows intentional interference by means of jamming is a major concern for aviation and other relevant applications. The authors see this as a clear indication for the necessity of permanently installed monitoring systems to secure safety critical applications relying on GNSS.
More research is needed regarding the interference event on December 10. We plan to conduct a second monitoring campaign where the monitoring system will be installed directly at a highway to see the increase of detections and severity. The developed monitoring approach will be extended toward non-stationary monitoring receivers and refined in accordance to aviation certification requirements.
Acknowledgment
The presented developments and monitoring campaign have been conducted in the course of two research projects ˝GNSS Interference Detection & Analysis System (GIDAS)˝ and ˝GNSS Vulnerability and Mitigation in the Czech Republic˝ funded by the European Space Agency (ESA) within the NAVISP program.
This article is based on material presented in a technical paper at ION GNSS+ 2021, available at ion.org/publications/ order-publications.cfm.
REFERENCES
- R. Morales-Ferre, P. Richter, E. Falletti, A. De La Fuente, and E. S. Lohan, “A survey on coping with intentional interference in satellite navigation for manned and unmanned aircraft,” IEEE Communications Surveys and Tutorials, vol. 22, no. 1, 2020.
- A. Jafarnia-Jahromi, A. Broumandan, J. Nielsen, and G. Lachapelle, “GPS vulnerability to spoofing threats and a review of antispoofing techniques,” 2012.
- J. A. Volpe, “Vulnerability Assessment of the Transportation Infrastructure Relying on the Global Positioning System,” U.S. Department of Transportation, p. 99, 2001.
- P. J. Teunissen and O. Montenbruck, Eds., Springer Handbook of Global Navigation Satellite Systems. Springer International Publishing, 2017.
- M. Wildemeersch, E. C. Pons, A. Rabbachin, and J. F. Guasch, “Impact Study of Unintentional Interference on GNSS Receivers,” Publications Office of the European Union, Tech. Rep., 2010. [Online]. Available: https:// ec.europa.eu/jrc/en/publication/eur-scientific-and-technical-research-reports/impact-study-unintentional-interference-gnss-receivers
- X. Chen, F. Dovis, S. Peng, and Y. Morton, “Comparative studies of GPS multipath mitigation methods performance,” IEEE Transactions on Aerospace and Electronic Systems, vol. 49, no. 3, 2013.
- A. Kemetinger, S. Hinteregger, and P. Berglez, “GNSS Interference Analysis Tool,” European Navigation Conference, (ENC-GNSS), 2013.
- R. H. Mitch, R. C. Dougherty, M. L. Psiaki, S. P. Powell, B. W. O. Hanlon, J. a. Bhatti, and T. E. Humphreys, “Signal Characteristics of Civil GPS Jammers,” Ion Gps 2001, pp. 1907–1919, 2011.
- J. R. Van Der Merwe, X. Zubizarreta, I. Lukcin, A. Rügamer, and W. Felber, “Classification of Spoofing Attack Types,” 2018 European Navigation Conference, ENC 2018, pp. 91–99, 2018.
- EUROCONTROL, “European GNSS Contingency/Reversion Handbook for PBN Operations, Scenarios and Options, PBN Handbook No. 6. Draft v0.3,” 2019.
- Radio Technical Commission for Aeronautics, “RTCADO-208, Minimum Operational Performance
Standards for Airborne Supplemental Navigation Equipment Using Global Positioning System (GPS),” 1991. - RTCA DO-229F, Minimum operational performance standards for global positioning system/wide area augmentation system airborne equipment,” 2020.
- RTCA DO-316, Minimum Operational Performance Standards (MOPS) for Global Positioning System/ Aircraft Based Augmentation System Airborne Equipment,” 2009.
- RTCA DO-253 Minimum Operational Performance Standards for GPS Local Area Augmentation
System Airborne Equipment,” 2017. - S. Bartl, “GNSS Interference Monitoring detection and classification of GNSS jammers,” Master Thesis, Graz University of Technology, 2014.
- O. Isoz, D. Akos, T. Lindgren, C.-C. Sun, and S.-S. Jan, “Assessment of GPS L1/Galileo E1 Interference Monitoring System for the Airport Environment,” in Proceedings of the 24th International Technical Meeting of The Satellite Division of the Institute of Navigation (ION GNSS 2011), sep 2011, pp. 1920–1930. [Online]. Available: http://www.ion.org/publications/abstract.cfm?jp=p{\&}articleID=9741
- S. Hinteregger and P. Berglez, “GNSS Airport Interference Monitoring System,” in Proceedings of the
International Symposium on Certification of GNSS Systems and Services (CERGAL 2014), Dresden, Germany, 2014. - D. Borio, F. Dovis, H. Kuusniemi, and L. Lo Presti, “Impact and Detection of GNSS Jammers on Consumer Grade Satellite Navigation Receivers,” Proceedings of the IEEE, vol. 104, no. 6, pp. 1233–1245, 2016.
- P. D.Welch, “The Use of Fast Fourier Trnasform for the Estimation of Power Spectra: A Method Based on Time Averaging Over Short, Modified Periodograms,” IEEE Transactions on Audio and Electroacoustics, vol. AU-15, no. 2, 1967.
- F. Butsch, “A concept for gnss interference monitoring,” in ION GPS ’99, 1999, pp. 125–135.
- M. L. Psiaki and T. E. Humphreys, “GNSS Spoofing and Detection,” Proceedings of the IEEE, vol. 104,
no. 6, pp. 1258–1270, 2016. - T. E. Humphreys, “Detection strategy for cryptographic gnss anti-spoofing,” IEEE Transactions on Aerospace and Electronic Systems, vol. 49, no. 2, pp. 1073–1090, 2013.
- A. Broumandan, A. Jafarnia Jahromi, V. Dehghanian, J. Nielsen, and G. Lachapelle, “GNSS spoofing detection in handheld receivers based on signal spatial correlation,” in IEEE PLANS, Position Location and Navigation Symposium, Myrte Beach, South Carolina, USA, 2012, pp. 479–487.
- Y. Liu, S. Li, Q. Fu, Z. Liu, and Q. Zhou, “Analysis of Kalman Filter Innovation-Based GNSS Spoofing Detection Method for INS/GNSS Integrated Navigation System,” IEEE Sensors Journal, vol. 19, no. 13, 2019.
- M. L. Psiaki and T. E. Humphreys, “GPS Lies,” IEEE Spectrum, vol. 53, no. 8, pp. 26–53, 2016.
- K. Borre, D. M. Akos, N. Bertelsen, P. Rinder, and S. H. Jensen, A Software Defined GPS and Galileo Receiver: A Single-Frequency Approach. Birkhäuser, Boston Basel Berlin, 2007.
- A. Pirsiavash, A. Broumandan, and G. Lachapelle, “Two-Dimensional Signal Quality Monitoring For Spoofing Detection,” NAVITEC 2016, no. 14-16 December, 2016.
Authors


