
As guest columnist Dino Smajlovic explains, testing allows for inertial error characterization and understanding, ensuring proper error budgets and more accurate navigation solutions. Rate tables are among the tools used, with some allowing testing, characterizing and modeling in one installation step.
DINO SMAJLOVIC, IDEAL AEROSMITH
In a previous issue, we discussed how various types of inertial errors contribute to position and attitude errors. Any reduction, or elimination, of the errors can greatly improve the final navigation solution. A common practice in the industry is to test inertial sensors before they’re deployed in the field to determine the magnitude of the errors. It is important to test for and characterize these errors to understand what portion of the error budget should be appropriated to them.
Traditionally, testing falls into two categories:
1. Performance testing and characterization: bias, scale factor errors, misalignment, bias instability, angle/velocity random walk, linearity, asymmetry, etc.
2. Environmental testing: vibration and shock, EMI, altitude, humidity, etc.
Performance testing characterizes values of the parameters that define inertial sensor performance, while environmental tests verify if the sensors will continue to operate in various conditions.
When performance tests are conducted, several different errors can be tracked and categorized. Some repeatable errors can be characterized and compensated for by introducing calibration models. Examples of these errors include temperature and thermal gradient effects for both bias and misalignment parameters, gain (scale factor) and non-linearities.
On the other hand, environmental testing includes verifying performance of the sensor in different environments a sensor/system can be exposed to. These environments include electro-magnetic interference (EMI), low/high pressure atmosphere, humidity, salt fog, etc. They are most often defined in standards like MIL-STD-810, MIL-STD-461, DO-160, etc.
While thermal testing is part of environmental testing, due to materials used in sensor design, almost all inertial sensor outputs are temperature dependent. That is, the output changes as the temperature changes, even as sensor input remains the same. Therefore, tests over temperature, including thermal gradients, are a key component of performance testing.
Performance testing is typically conducted on specialized test equipment for inertial sensors and systems, referred to in the industry as the rate (and positioning) table.
Inertial Sensor Performance Testing
To initiate performance testing, inertial sensors are exposed to a known rotational input (zero, Earth rate or higher rate) for gyros and a known acceleration by using certain components of the gravity field for accelerometers. Typically, a 2-axis rate table is used for this, with a set of rotations (spins) being performed over different rotational rates and a set of position steps (tumbles) that rotate the sensor over 360° with respect to the direction of gravity. This exposes the sensor to varying amounts of acceleration. For higher performing sensors, it is critical that the rate table and the sensor are positioned as precisely as possible with respect to horizontal level and the Earth’s rotation. As gravity is typically used for accelerometer excitement, the table is oriented perpendicular to the direction of the local gravity field to establish a no acceleration position as a starting and comparison point. When testing gyros, precise orientation with respect to the Earth’s axis of rotation allows for the removal of the Earth’s rotation rate (15.04 deg/hr).
From these basic spin and tumble tests, bias, scale factor and misalignment errors can be deduced by comparing rate table inputs in terms of rotation rates or positions to sensor outputs measuring rates and/or accelerations.
Additional tests can be performed on the rate table to characterize other parameters, such as scale factor non-linearity and asymmetry, bias acceleration sensitivity, high acceleration (centrifuge) testing, threshold, bandwidth, etc.
Most of these tests are also performed over temperature to verify performance over the designated thermal range for inertial sensors. As mentioned, inertial sensor outputs are temperature dependent so the output parameters vary over the temperature. In instances where effects are repeatable, modeling can be applied to inertial sensor outputs to compensate for these effects. Adding modeling to the sensor output improves sensor performance and thus the navigation solution is improved.
To develop proper modeling, rate and positioning tables are used to provide precise input. The most common compensation models are used for change in temperature, thermal gradient and scale factor non-linearity.
The Basic Steps in a Modeling Routine
Gyros are exposed to a set of rotations at different rates, either at fixed temperatures or as the temperature ramps up or down. Data is collected during the spins and also between the spin sets, as that data can be used for bias modeling. Accelerometers are exposed to a set of tumble points, exposing sensors to varying acceleration fields by adjusting the orientation angle with respect to the gravity field. The tumble sets are performed over the same or similar thermal conditions as rotation sets.
Sensor data is collected during these sets of tests (spins and tumbles). Using rate table position and rate accuracy capabilities, sensor outputs are compared to the position and rate information from the rate table. A set of equations is created and solved for thermal effects to create a set of coefficients applied to sensor outputs, thus compensating for the temperature effects. Once the model is created, calculated model coefficients need to be applied to the sensors. This step is typically performed inside the microprocessor close to the sensor to minimize transmission effects on raw, uncompensated data.
Once the model is applied to the sensor output, the next step is compensation model verification. After the model is applied to the output, inertial sensors are exposed to a different set of thermal environments, rotational rates and acceleration levels. In general, this set is different from the one used to calculate the model. This ensures the compensation model provides improved performance over the sensor’s prescribed operating ranges.
Rate tables also can be used to develop compensation models for gain variations (linearity of the output). If scale factor errors are repeatable, a similar model can be developed to compensate for variation in the output due to the sensor non-linearity. For gyros, sensors are exposed to different rotational rates covering the sensor operating range. For accelerometers, high acceleration rates are obtained by using centripetal force generated by placing the sensor on the edge of the tabletop and spinning it.
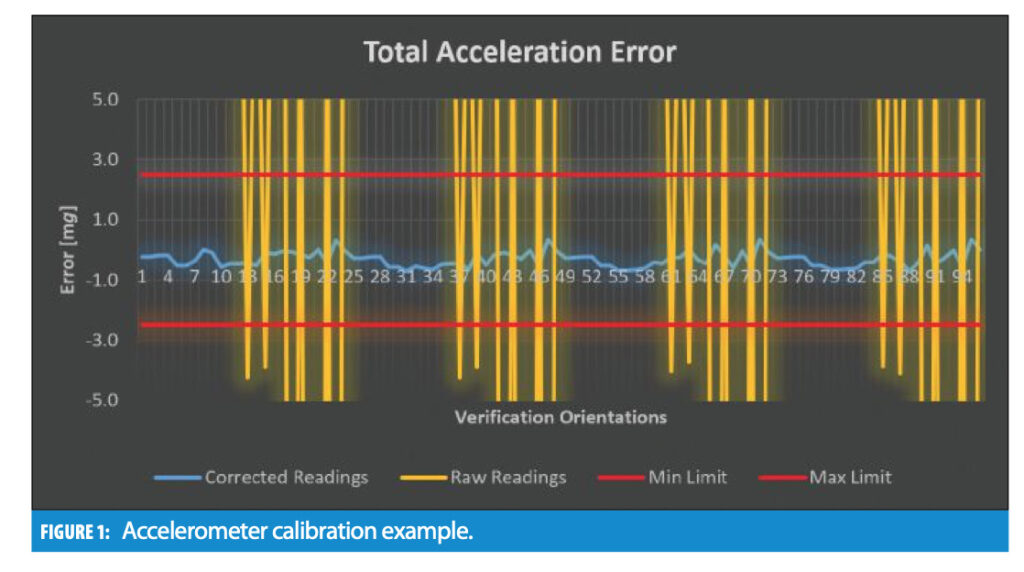
Based on data gathered from these tests, compensation models are developed as described previously. Methods to apply this model to the sensor output and verification of the model itself are similar to the descriptions for the thermal compensation model. Figure 1 shows an accelerometer calibration example, wherein a significant reduction in the output error is evident once the calibration parameters are applied.
Rate and Positioning Tables
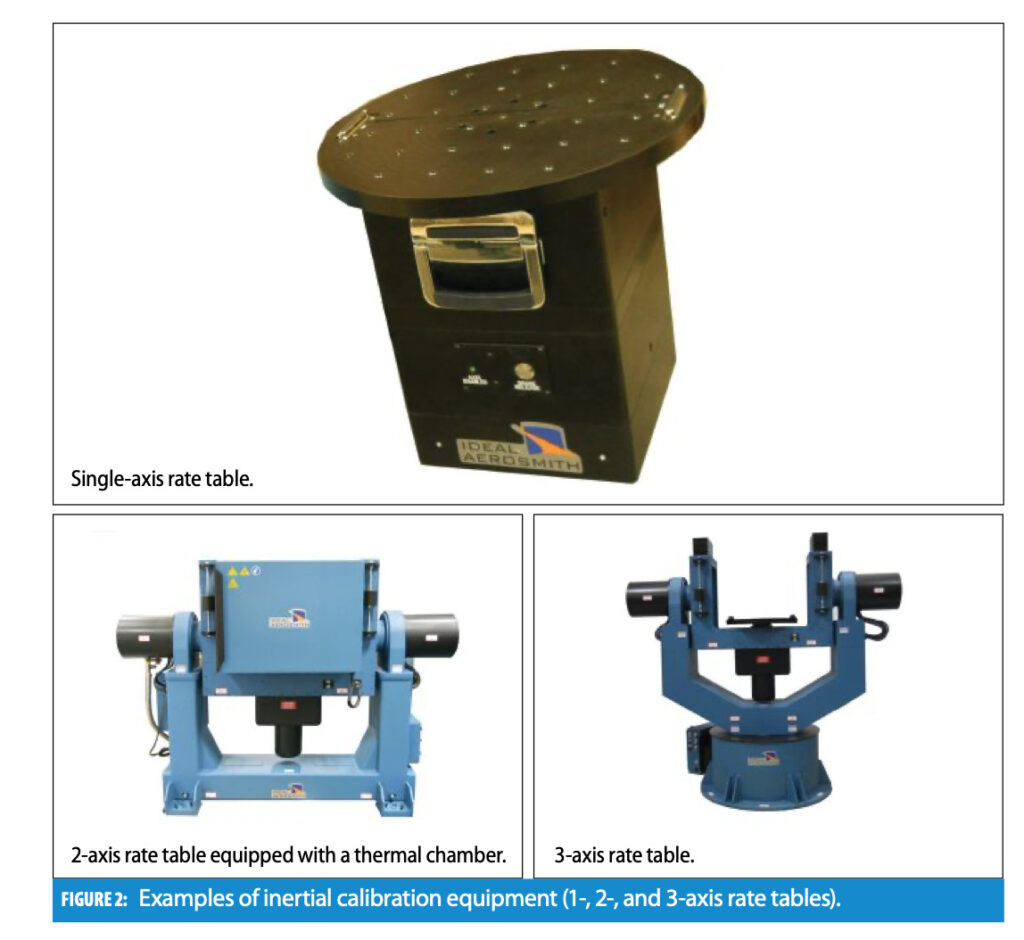
As described before, rate and positioning tables are designed to provide high accuracy motion simulation. Rate tables are categorized by size, number of axes and precision levels. For example, Ideal Aerosmith offers 1-, 2- and 3-axis rate tables. The 2-axis system is the workhorse of the industry, as it allows complete testing of the six DOF sensor (three gyros and three accelerometers) with only a single device mounting step.
Rate tables come in different sizes, with the smallest having the test device mounting area (referred to as the tabletop) of 8 inches in diameter, while the largest tabletops can be 36 inches or more in diameter. Rate table performance is commonly defined by position accuracy and rotation rate accuracy.
To illustrate, Ideal Aerosmith tables are offered with position accuracies of 30- 15-, 10-, 8- and 1-arcsec, while rotation rate accuracies range from 0.01% to 0.0001%, as measured over a full rotation. In addition to the parameters described, there are others used to characterize rate table performance, such as wobble, orthogonality, runoff, tabletop flatness, etc., that typically vary less from system to system and have less impact on the rate table as a testing tool for inertial sensors.
To enable testing over the change in temperature, the rate table can be equipped with a thermal chamber. The main difference in the chamber design is the medium used to introduce temperature change. A mechanically cooled thermal chamber operates similarly to a refrigerator; it uses heat exchange to incite temperature change. A liquid nitrogen (LN2) cooled thermal chamber uses nitrogen gas to cool the test volume down and electric resistive heaters to heat it up, while a CO2 chamber uses CO2 (dry ice) for cooling and resistive elements for heating.
When it comes to determining the proper rate table to test different grades of inertial sensors, the most important specifications are rate accuracy and stability as well as position accuracy and repeatability. Rotation rate accuracy and stability ensure proper evaluation of the gyro scale factor and non-linearity errors. The best Ideal Aerosmith rate table provides a rotation rate equivalent to ~1 ppm scale factor error over 360°. Position accuracy and repeatability are crucial for bias and misalignment measurements for both sensor and accelerometer scale factor errors. The Ideal Aerosmith rate table enables measuring acceleration up to a few micro-gs.
Most high-end rate tables are equipped with a thermal chamber to allow for performance testing over the prescribed thermal range. This allows the rate table to be the single piece of test equipment that can be used for inertial sensor testing, characterization and verification. This greatly reduces the time needed to properly evaluate inertial sensors either during sensor production or while integrating them into a different product (such as a GNSS/INS module).
Figure 2 shows examples of 1-, 2- and 3-axis rate tables.
Conclusion
Inertial sensors are routinely tested to determine the magnitude of inertial errors so the proper error budget can be allocated when developing the navigation solution. Certain types of repeatable errors can be modeled and compensated for with the proper compensation model. This process improves the overall navigation solution. Rate tables are specifically designed to enable inertial sensor testing with a single installation step. Inertial sensors can be tested, characterized and modeled using rate tables like those manufactured by Ideal Aerosmith.
Author
Dino Smajlovic received his MS in Aeronautical Engineering from Purdue University and MS in Physics from Bowling Green State University. Dino spent 7+ years at Systron Donner Inertial as a systems engineer and later as a test group manager, developing and testing inertial sensors and systems. For the last 9 years Dino has held roles in business development and sales in the fields of motion simulation and testing and SW development and certification. Dino joined Ideal Aerosmith’s sales team in 2019.
For more information on Ideal Aerosmith’s test solutions and lab services, click here.


