The value of the GPS SPS PS goes far beyond the specific parameters that it contains. It has a great deal of information regarding how GPS operates and ideally should be read in full (including the appendices) by everyone who works with GPS at the measurement level.
This column reviews the information in the latest SPS PS and shows how it improves the performance of GPS applications. Since this information is used in real time to generate error bounds at high probabilities (“protection levels”) for applications with demanding integrity and continuity requirements, it also discusses the origin of these parameters and the level of reliance that can be placed on them.
In April 2020, the U.S. Government released the 5th Edition of the Global Positioning System Standard Positioning Service Performance Standard (known in short as the “GPS SPS PS” or just “SPS PS”) [1]. This was the first update to the GPS SPS PS in 12 years, as the previous 4th Edition was issued in 2008 [2] (the original version dates to 1993). The new 5th edition contains significant new information as well as tighter standards that at least partially reflect the continued improvements in the GPS Signal-in-Space (SIS) since the mid-2000s.
The Meaning of “Performance Standards”
The SPS PS “Executive Summary” states that “This SPS Performance Standard (SPS PS) specifies the levels of SPS performance in terms of broadcast signal parameters and GPS constellation design. The U.S. Government is committed to meeting and exceeding the minimum levels of service specified in this SPS PS.” Furthermore, “Since GPS initial operational capability (IOC) was first declared in 1993, actual GPS performance has continuously met and exceeded minimum performance levels specified in the SPS PS and users can generally expect improved performance over the minimum levels described here.” [1]
In other words, the “standards” in the SPS PS are based on observed GPS performance over more than 25 years and represent minimums that GPS has consistently met and exceeded. GPS should at least continue to meet or improve upon these standards for the foreseeable future. The U.S. Government evaluates the GPS program and its personnel on whether these SPS standards are met. As noted in [1], the Federal Aviation Administration (FAA) William J. Hughes Technical Center monitors the performance of GPS over time and publishes quarterly Performance Analysis Network (PAN) reports [3] showing recent GPS performance compared to the SPS standards.
While SPS PS standards have always been met (to the author’s knowledge) and are routinely exceeded, as will be shown below, the GPS program cannot guarantee this due to its limited ability to monitor the L1 C/A-code signals that are the basis of SPS in real time. This fact must be kept in mind when applying the standards to safety-critical GPS applications. As an example, the use of modified (dual-frequency, L1 C/A and L5C) GPS SPS within Advanced RAIM or ARAIM (see [4, 6]) depends upon the broadcast of an Integrity Support Message (ISM) containing key integrity parameters, such as the probability of a single GPS satellite being in a faulted state that is not obvious (Psat). These parameters are based on performance commitments from GPS and other constellation service providers but are backed up by ground monitoring and can be changed if violations are detected (depending on the timeliness of both the monitoring and the ISM message updates).
Performance and Accuracy Standards
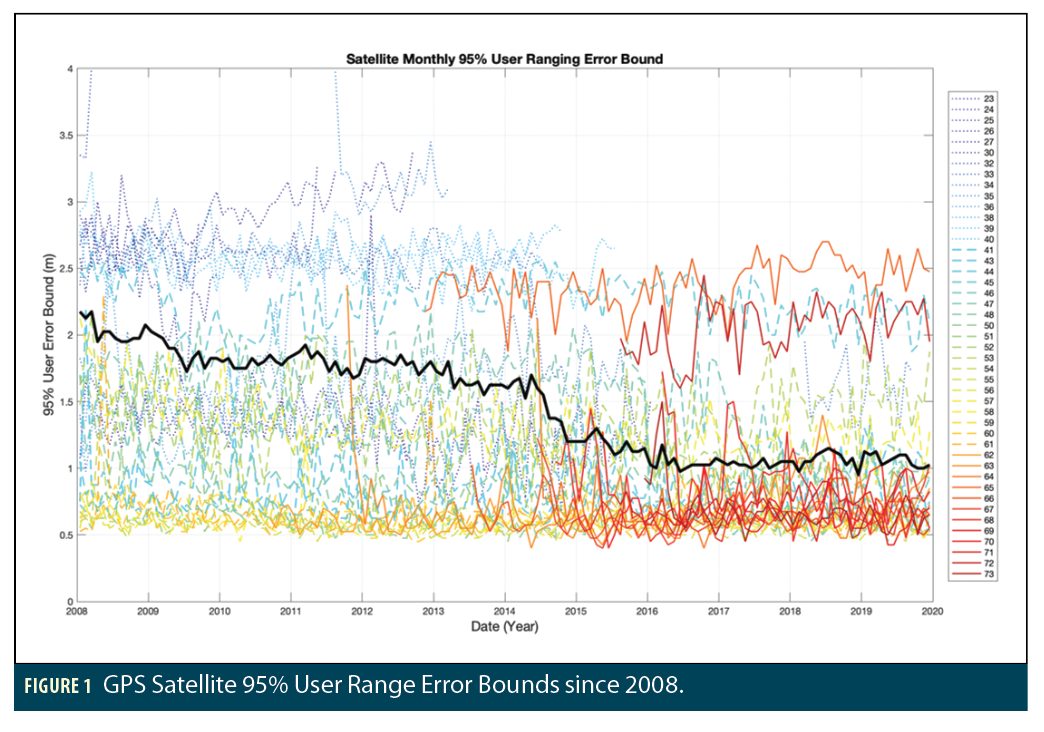
Figure 1 illustrates GPS SIS User Range Error (URE) performance and shows how it has improved over time. In Figure 1, 95th-percentile (roughly 2-sigma) bounds on estimated URE for each GPS satellite (indexed by SVN on the right) during each month since 2008 are shown as determined by a network of ground stations collecting samples every 15 minutes (extended from [5]). The thick black line indicates the 95% URE bound over all active satellites. Lower UREs provided by the improved clocks in newer satellite types and GPS Control Segment (CS) improvements have contributed to the steady decrease in overall constellation URE, but a significant spread between best and worst-performing satellites (even within the same Block type) remains to this day.
Section 3.4 of the SPS PS [1] defines accuracy standards for URE as well as for URRE (User Range Rate Error), URAE (User Range Acceleration Error), and UTC time offset error (UTCOE). All these errors reflect GPS SIS contributions and not those due to atmospheric or user errors. Only URE will be addressed here due to space constraints.
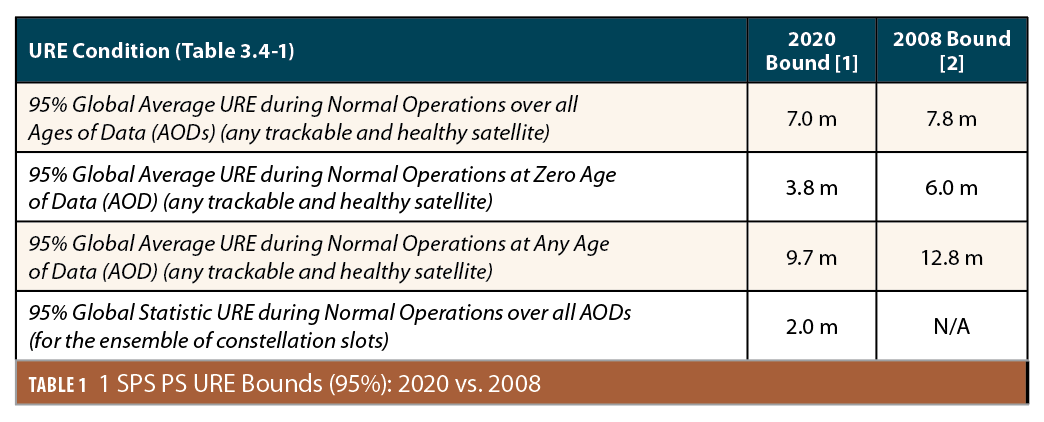
The first and fourth rows of Table 3.4-1 have four key parameters that are summarized in Table 1. The key distinction between them is Age of Data (AOD), or the time elapsed since the clock and ephemeris parameters within the GPS navigation data were computed by the GPS CS. The URE bound in the first row is an average over all AODs across the constellation within the range of “normal operations,” meaning that each satellite receives a CS upload with new clock and ephemeris parameters at least once per day. The bound in the second row is for the theoretical (but impractical) possibility of Zero AOD and thus represent a lower bound on URE based on CS modeling and navigation data quantization errors. The bound in the third row is a worst-case value, as it applies to “any AOD” and thus must cover the maximum AOD within “normal operations,” which is 26 hours with 1 upload per satellite per day and 10 hours with 3 uploads per satellite per day. As Table 1 shows, these URE bounds have improved significantly between the 4th and 5th Editions of the SPS PS.
The bounds in the first three rows of Table 1 apply to any usable (trackable and healthy satellite), meaning that they individually cover each healthy satellite in the constellation (including those with relatively high errors). The fourth row of Table 1 is new in the 5th Edition of the SPS PS and provides an ensemble URE bound over all usable satellites. This distinction is important, as shown in Figure 1, where the ensemble 95% URE bound entering 2020 (about 1.0 m, according to the thick black line) is much lower than the bound for the satellite with the largest error (about 2.5 m). Both of these numbers are well below the bounds over all AODs of 2.0 and 7.0 m, respectively, which indicates the amount of margin still present in the SPS PS parameters.
GPS Satellite Constellation Definition
Section 3.2 of the GPS SPS PS defines the orbit parameters of the baseline and expandable 24-slot GPS constellations that the GPS CS attempts to maintain. The parameters in the 5th Edition [1] have been changed from earlier versions. In particular, the orbit parameters in Table 3.2-1 have different time epoch and Greenwich Hour Angle as well as modified RAAN and Argument of Latitude parameters for each orbit slot for this new epoch (note that “Argument of Latitude” is the sum of the Argument of Perigee and Mean Anomaly angles that are provided separately in GPS almanacs). However, the Groundtrack Equatorial Crossing (GEC) or Geographic Longitude of the Ascending Node (GLAN) angles remain the same, indicating that the same satellite ground tracks on Earth’s surface are being maintained. In addition, the three expandable orbit slots from before (B1, D2, and F2), where two nearby satellites could be present instead of a single satellite, have been augmented by three more in slots A2, C4, and D3, so that there is now one expandable slot per orbit plane. Table 3.2-2 shows how each expandable slot would be occupied by two nearby orbit slots rather than the single slot in Table 3.2-1.
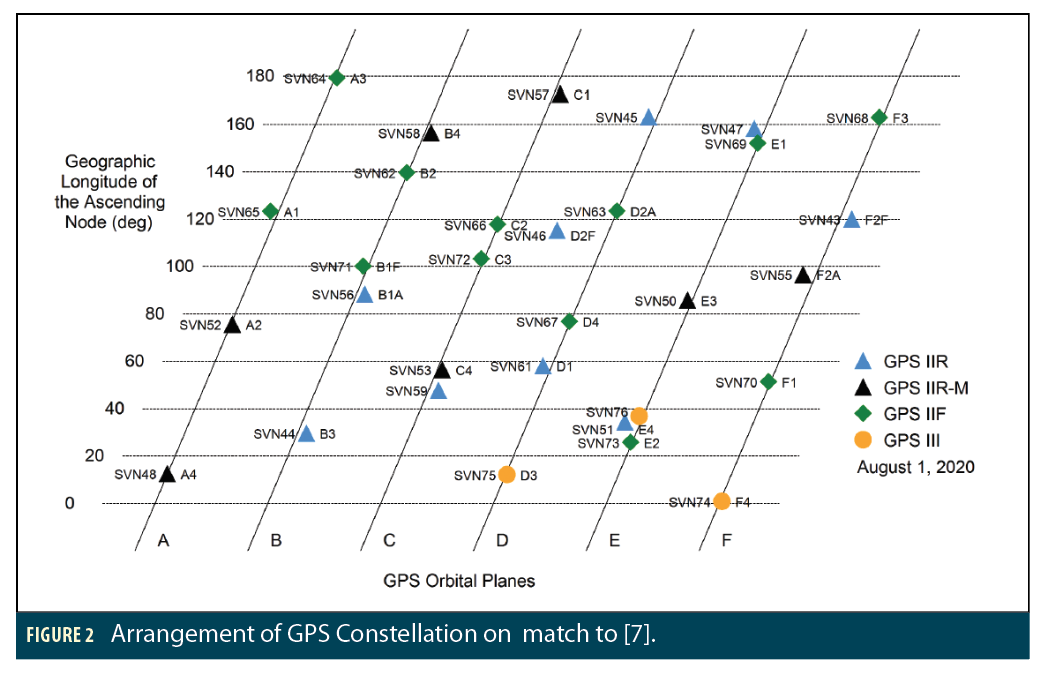
For comparison, Figure 2 shows a recent depiction of the GPS constellation as of August 1, 2020 [7]. At that time, 31 satellites were in orbit, and all orbit planes except the A Plane had more than four satellites present. Expandable slots B1, D2, and F2, which were already defined in 2008 [2], each had two satellites ((F)ore and (A)ft) in them. Four other satellites were present in auxiliary “spare” slots: SVN 59 in the C Plane, SVN 45 in the D Plane, and SVNs 47 and 76 in the E plane. The GLAN (or GEC) values on the y-axis can be roughly compared to the ideal values in Tables 3.2-1 and 3.2-2 and match to within a few degrees.
Error Bounding and Integrity Standards
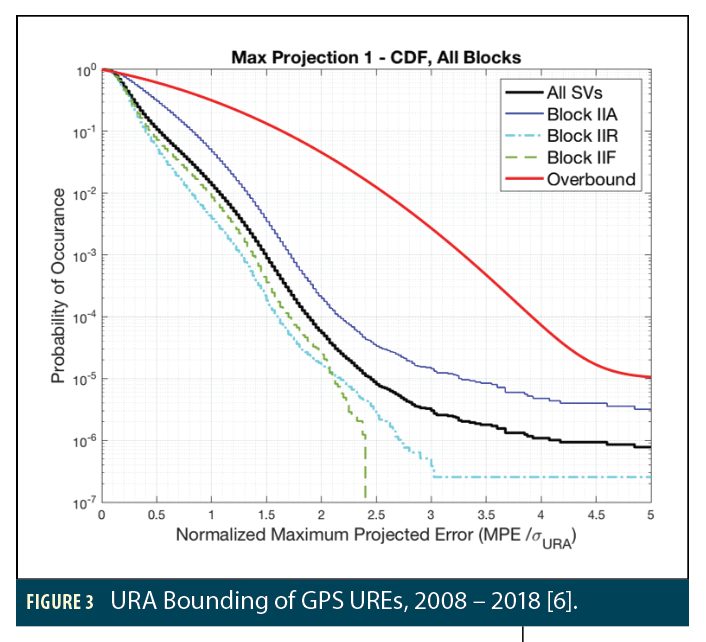
Figure 3 shows how GPS UREs were bounded by the User Range Accuracy (URA) bounds derived from the navigation data broadcast by each GPS satellite from 2008 to 2018, inclusive [6]. In this plot, Maximum Position Errors (MPEs) are estimated and are normalized by the URA derived for that satellite. MPE differs from URE in that it represents the maximum satellite clock and orbit error projected onto earth at the time in question (as opposed to the URE at a specific user location) [5]. In Figure 3, satellites of the same Block type are grouped together (along with all SVs combined) and show that newer satellites (Blocks IIR and especially IIF) have lower errors relative to URA. All these lines are bounded by the red line representing the standard Gaussian distribution (which represents the “overbound” provided by URA after normalization) out to at least a probability of 10-5.
Section 3.5 of the GPS SPS PS defines the integrity parameters that apply to UREs and other errors. Table 3.5-1 states that the probability of URE from any satellite exceeding an NTE tolerance given by 4.42 times the URA derived from the broadcast navigation data without a timely alert being issued (within 10 seconds) is no greater than 10-5 over any hour during normal operations. Note that 4.42 represents the value of a standard Gaussian distribution covering both positive and negative tails to a probability of 1–10-5. Thus, this requirement effectively states that a Gaussian distribution with zero mean and variance given by URA2 bounds the true URE out to 10-5 under the listed conditions, and this is what is demonstrated in Figure 3. The listed conditions include the satellite in question having URE below NTE at the start of the hour and that the worst-case delayed alert is 6 hours after the URE ≤ NTE criterion is violated. This has not changed in the 5th Edition of the SPS PS, but Figure 3 shows that the margin by which this requirement is met has increased greatly since 2008 (recall that no Block IIA satellites remain in the GPS constellation).
Table 3.5-5 is an important addition to the 5th Edition of the SPS PS. It gives specific parameters for the Psat and Pconst parameters required for ARAIM and contained in the ARAIM ISM mentioned earlier. Psat represents the state probability (probability at any given time) that any individual satellite is in a faulty (but still usable) state, while Pconst represents the state probability of a correlated constellation failure across multiple (or all) satellites. These values are 10-5 for Psat and 10-8 for Pconst, respectively, using the same definition of fault (URE > NTE) as in Table 3.5-1. In addition, the mean delay before an alert takes place (at which point a failed satellite is no longer usable) is given as 1 hour, which allows conversion between these state probabilities and the probability rates per time interval used in ARAIM.
The value of 10-5 for Psat is not new, as it was already implied by the requirement in Table 3.5-1. Only 5 satellite-fault events under the SPS PS definition have been observed since 2008 (with none observed since 2012) [5], which provides confidence that the value of Psat will continue to be met with margin in the future. However, the value of 10-8 for Pconstis new and represents a much lower probability than thought to be independently verifiable by ARAIM [4]. Given a mean alert delay of one hour, the implied constellation failure rate is 10-8 per hour, or approximately one failure per 11,400 years. This is difficult to verify from the history of GPS (even given that no such faults have been known to occur since 1995) or from continuous ground monitoring. However, it represents a commitment that is of significant value to ARAIM users if it can be relied upon. As shown in [9], it would allow ARAIM to be implemented using the GPS constellation only and still support applications with integrity risk requirements of 1 in 10-7 per operation. Previously, the use of multiple GNSS constellations was assumed to be required for these applications so that each constellation could be cross-checked against at least one other in real time [4].
GPS Continuity and Availability Standards
Sections 3.6 and 3.7 of the SPS PS define standards on GPS satellite (or orbit slot) continuity and availability. For continuity, meaning unscheduled signal interruption (e.g., a satellite in a given orbit slot suddenly broadcasts an “unhealthy” flag without warning from a previous NANU), Table 3.6-1 limits this probability to 1–0.9998 (or 0.0002) over any hour given that the signal from that orbit slot was available and healthy at the start of that hour. This value represents a mean time between failures (unscheduled interruptions) of 5,000 hours, or 0.57 years, which is conservative given observed GPS history. This value applies to the ensemble of satellites across the GPS constellation; it may not be met for older satellites with limited redundancy that are more vulnerable to unscheduled interruptions [8].
Table 3.7-1 specifies a state probability of 0.957 or greater of a slot in either the baseline or expandable 24-slot configuration being occupied by a satellite broadcasting a healthy SIS (meaning appearing to be “healthy” and meeting the other SPS PS standards). Again, this is an average over all slots in the constellation and may not be met for a given slot that is occupied by an older satellite. This number has not changed from the 4th Edition and is based on the conservative outage model given in Section A.7; thus, it has been met with margin since at least 2008. The notes under Table 3.7-1 clarify that, while the 24 baseline slots should be occupied by at least one satellite, the six expandable slots of these 24 shown in Table 3.2-2 are not always occupied by two satellites, and if they have two satellites, losing availability from one of them does not constitute loss of availability from that slot.
Conclusions
This article describes the key performance standards provided by the 5th Edition of the GPS SPS PS released in 2020, how they have improved beyond the 4th Edition of 2008, how they compare to observed performance, and the degree of reliance that can be placed on them. In general, observed GPS performance significantly exceeds these standards, providing confidence that the parameters in the PS will continue to be met with margin. However, the GPS Program cannot physically guarantee this due to its limited resources. Care should be taken when applying these standards, or any similar standards, to safety-of-life-critical GNSS applications.
The value of the GPS SPS PS goes far beyond the specific parameters that it contains. It has a great deal of information regarding how GPS operates and ideally should be read in full (including the appendices) by everyone who works with GPS at the measurement level. Other GNSS constellation providers should follow the lead of the GPS SPS PS and provide public standards for their own open-service signals once they gain sufficient operational history.
References
(1) Global Positioning System Standard Positioning Service Performance Standard, Washington, DC, U.S. Dept. of Defense, 5th Ed, April 2020. https://www.gps.gov/technical/ps/2020-SPS-performance-standard.pdf
(2) Global Positioning System Standard Positioning Service Performance Standard, Washington, DC, U.S. Dept. of Defense, 4th Ed (superseded), Sept. 2008. https://www.gps.gov/technical/ps/2008-SPS-performance-standard.pdf
(3) “GPS PAN Report Archive,” U.S. Federal Aviation Administration, William J. Hughes Technical Center, Atlantic City, NJ. Updated Oct. 2020. https://www.nstb.tc.faa.gov/DisplayArchive.htm
(4) “Milestone 3 Report of the E.U.-U.S. Cooperation on Satellite Navigation Working Group C: ARAIM Technical Subgroup,” Final Version, Feb. 25, 2016. https://www.gps.gov/policy/ cooperation/europe/2016/working-group-c/ARAIM-milestone-3-report.pdf
(5) T. Walter, K. Gunning, R.E. Phelts, J. Blanch, “Validation of the Unfaulted Error Bounds for ARAIM,” Proceedings of ION Pacific PNT 2017, Honolulu, HI, May 2017. http://web.stanford.edu/group/scpnt/gpslab/pubs/papers/Walter_IONPNT_2017.pdf
(6) T. Walter, J. Blanch, K. Gunning, “Standards for ARAIM ISM Data Analysis,” Proceedings of ION Pacific PNT 2019, Honolulu, HI, April 2019. http://web.stanford.edu/group/scpnt/gpslab/pubs/papers/Walter_Standards_for_ARAIM_ISM_IONPacPNT2019.pdf
(7) “U.S. Coast Guard Navigation Center (NavCen) GPS Constellation Status,” https://www.navcen.uscg.gov/? Do=constellationStatus, Accessed Dec. 16, 2020. Direct link to figure at: https://www.navcen.uscg.gov/pdf/gps/current.pdf
(8) S. Pullen, P. Enge, “Using Outage History to Exclude High-Risk Satellites from GBAS Corrections,” Navigation, Vol. 60, No. 1, Spring 2013, pp, 41-51. https://www.ion.org/publications/abstract.cfm?articleID=102590^p
(9) A. Katz, S. Pullen, S. Lo, et al., “ARAIM for Military Users: ISM Parameters, Constellation-Check Procedure and Performance Estimates,” Proceedings of ION ITM 2021, San Diego, CA (virtual), Jan. 2021 (forthcoming).