
Hemisphere GPS Unveils New Antennas, DGPS Receiver for Handheld Mapping
XF102Hemisphere GPS has launched its XF102 DGPS receiver, the latest addition to the company’s XF-Series of differential GPS receivers for handheld mapping.
By Inside GNSSGlobal Navigation Satellite Systems Engineering, Policy, and Design
XF102Hemisphere GPS has launched its XF102 DGPS receiver, the latest addition to the company’s XF-Series of differential GPS receivers for handheld mapping.
By Inside GNSS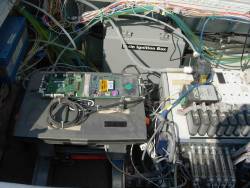 A Topcon Euro 160T mobile control board connected to a laptop computer collects satellite positioning signals used to calculate the North American Eagle’s speed. Photo: Don Talend
A team led by led by Seattle, Washington–area aerospace and computer experts is attempting to break the sound barrier to surpass the world land speed record of 763 miles per hour — and they’re using GNSS technology to help them do it.
By Inside GNSS
Rome wasn’t built in a day, and neither was the Global Positioning System.
Nor will the emerging GNSS system of systems arising from the regional and global infrastructures being put in place or modernized today: GPS, GLONASS, Galileo, Compass (Beidou-2), QZSS, GAGAN, IRNSS, EGNOS, WAAS, MSAS, and undoubtedly other acronyms yet to be born.
By
DataGrid, Inc. has released the third generation of its programmable DGRx-GNSS receiver for OEM integrators as well as a high-sensitivity mode for DGRx-GNSS that allows the receiver to track the L1 and L2C codes transmitted by GPS and GLONASS satellites down to a signal level of only 15 dB-Hz.
By Inside GNSS
Leica Viva from Leica Geosystems is a new-generation measurement system that combines a number of technologies into a portfolio of total stations, GNSS receiver, system controllers and onboard software.
The Viva GNSS suite’s GS10 and GS15 system controllers can be used for all tasks and setups for GNSS surveying and construction, including all-on-the-pole or backpack rover; mounted on a car, quad or boat; RTK field base station; and long term monitoring sensor.
By Inside GNSS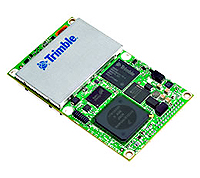
Trimble introduced its new Trimble BD970, a real-time kinematic (RTK) GNSS receiver for high-precision and control application, at the ION GNSS 2009 show in September.
Capable of receiving a wide range of commercially available satellite signals, the BD970 receiver is designed to allow OEMs and system integrators to easily add centimeter-level positioning to specialized or custom hardware solutions.
By Inside GNSS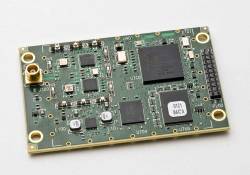 NovAtel OEMStar
NovAtel Inc. rolled out a series of new products and a firmware upgrade at the Institute of Navigation’s ION GNSS 2009 conference held September 22-25 in Savannah, Georgia, USA.
The Calgary, Alberta, Canada–based GNSS manufacturer announced the launch of their new single-frequency GNSS receiver, OEMStar. The low-cost, 14-channel, L1 receiver measures 46 x 71 millimeters and consumes just 750 milliwatts of power when tracking both GPS and GLONASS signals.
By Inside GNSS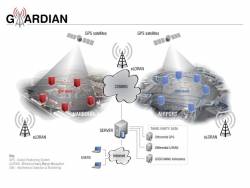
Chronos Technology, Lydbrook, Gloucestershire, United Kingdom, is leading an academic and business research consortium working on the GAARDIAN Project — “GNSS Availability, Accuracy, Reliability anD Integrity Assessment for Timing and Navigation.”
By Inside GNSS
My history with GPS began during the time of the “Cold War” in what was then Czechoslovakia. In 1975, the ION Journal of Navigation was the only information available to me. Despite that, my team at the Czech Technical University developed a GPS receiver and measured the position of our faculty in 1984. In those relatively isolated years, we gained a good deal of experience with GPS signals.
By
GeoWAY, now in its fifth year, will cover intelligent transport systems and satellite navigation. It will take place in Pavillion 1, Hall 1 at the Crocus Exposition Center in Moscow, Russia from March 30 to April 2 2010.
It is one of the four specialized exhibitions of GeoForm+ 2010, the seventh international industrial Forum of geodesy, cartography, navigation, geoinformation systems, engineering geology and geophysics, tunnel and utility systems construction.
By Inside GNSS

This year, the International Symposium on GPS/GNSS, which rotates throughout the Asia-Pacific region, will take place in semitropical Jeju, Korea’s only island province, November 4 to 6, 2009.
The theme is "Interchangeability for PnP GNSS".
The chair of the program committee is Chungnam National University Professor Sang Jeong Lee.
By Inside GNSS NavCom SF-3050
NavCom Technology, Inc., has announced the release of the SF-3050 multi-frequency GNSS receiver that incorporates the company’s new Sapphire GNSS OEM board.
Offering integrated StarFire/RTK GNSS capabilities, the SF-3050 and Sapphire feature 66-channel tracking, including multi-constellation support for GPS, GLONASS and Galileo.
By Inside GNSS
The recent GAO report and Government Oversight subcommittee hearing on GPS sustainability generated more heat than light, with some major news media outlets leaving the impression that the sky (or at least GPS satellites) would soon be falling.
Perhaps the only silver lining in the ensuing Chicken Little phenomenon was the crude measure it provided of just how familiar (but not necessarily knowledgeable) private citizens have become with GPS.
By