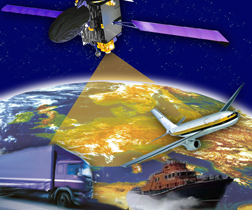
Newcomers often have difficulties imagining what the satellite orbits actually look like.
We say that the constellation consists of some 30 satellites orbiting in six different planes, all making an angle with the Equator of 55 degrees and rotated 60 degrees compared to the previous plane. Figure 1 shows the situation as seen from far away in space, in what we call an inertial frame.
However, things get less clear if the viewer is on the surface of the rotating Earth. How do the trajectories then look?
Very weird is how.
The situation is depicted in Figure 2.
Here we use the so-called Earth Centered Earth Fixed (ECEF) coordinate system. The ECEF system is in a fixed relationship with the rotating Earth. That is, a given physical point on the surface maintains its coordinates over time, except for possible movements of the crust.
Finally, Figure 3 shows a curve made up of the sub-satellite points of an arbitrary part of an orbit.
The curve is the intersection between the surface of the Earth and the line segment between the satellite and the origin. This sub-satellite curve runs within a symmetric belt on both sides of equator and is limited by northern and southern latitudes equal to the inclination angle of the orbit with the equator.
easy 18
Once I was teaching GPS to control engineers working with air traffic. A need came up for computing range and range rate corrections at a base station. Here is the solution.
Let ρ denote the geometric distance between the satellite and the receiver antennas, dti denote the receiver clock offset, dtk the satellite clock offset, and T the tropospheric delay. Then the corrected range is computed as
ρ* = ρ + cdti – cdtk + T
and the range correction as
d = ρ* – Pobs.
Figure 4 shows range and range rate corrections over 23 epochs using September 4, 2001, data.
The receiver clock offset pos(4,:) varies between 1.13 × 10⁵ and 1.15 × 10⁵ through the 23-second period of observations.
Acknowledgements
The help received for the EASY Suite II series from Kostas Dragūnas at the Danish GPS Center is greatly acknowledged. His help includes the sky plot, the Stanford plots, and data collection during winter time.
My thanks also go to Professor Per Enge for several invitations to stay at Stanford University’s Center for Position, Navigation, and Time. I appreciated the wonderful facilities there, and all of the people I encountered. They showed so much kindness and helpfulness, and made my stays comfortable.
Finally I am very grateful to Steve Hilla for his comprehensive help in converting the manuscript from latex into Word.


