The SAGAIE network was deployed in West-Africa in 2013 to assess the feasibility of an equatorial for ASECNA SBAS by studying ionospheric scintillation. This study of the network’s measurements, taken between 2013 and 2016, analyzes the characteristics of the scintillation recorded by five receivers that cover Sub-Saharan West-Africa.
By AURÉLIEN GALMICHE, SÉBASTIEN TRILLES, SÉBASTIEN ROUGERIE, THALES ALENIA SPACE
VINCENT FABBRO, ONERA/DEMR
LAURENT FÉRAL, LABORATOIRE D’AÉROLOGIE, UMR 5560
JULIEN LAPIE, LOUIS BAKIENON, ASECNA
The Satellite Based Augmentation System ASECNA for Africa & Indian Ocean (A-SBAS), led by the Agency for Air Navigation Safety in Africa and Madagascar (ASECNA), an international organization of 18 Member States in charge of air navigation services provision in 16 million square kilometers, is under development in view of services declaration in the next years. A-SBAS is recognized by the International Civil Aviation Organisation (ICAO) as the part of the Global Navigation Satellite Systems (GNSS) infrastructure. It is designed to deliver a safe positioning accuracy by augmenting the GPS satellite navigation constellation with differential corrections and integrity data, in order to enable advanced navigation operations down to precision approaches in all runway ends in Africa. The core of the mission consists of decomposing all possible range error sources and distributing corrections and/or alerts to its users by means of geostationary satellites.
The major range error source affecting the A-SBAS system performances is the ionosphere dynamic because the magnetic equator, as a main driver, crosses the Western African sector. This particular latitudinal situation is one of the factors leading to the apparition of the ionospheric scintillation at night and close to the equinoxes in this area.
The SAGAIE network of GNSS stations was deployed in Western Africa in 2013 by CNES and ASENCA to assess the feasibility of an equatorial SBAS for ASECNA area by studying the phenomenon, which has a strong negative influence on GNSS signals, among others.
This study of the SAGAIE network’s measurements aims to analyze the characteristics of the scintillation recorded by the five receivers covering Sub-Saharan West-Africa between 2013 and 2016. This period covers almost half a solar cycle, with the scintillation highly varying. It is shown that scintillation has a temporal global pattern well marked in the five SAGAIE stations: an increase after local sunset, a peak between 8 and 11 p.m. and a decrease overnight. The amplitude of the phenomenon increases close to the equinoxes, where scintillation is at its maximum. However, variability in temporal occurrence or magnitude with longitude and latitude has also been observed in the different stations.
The Importance of Studying Scintillation
The ionospheric scintillation phenomenon is characterized by a strong fluctuation of the phase and amplitude of the radio wave received on Earth. It is due to small-scale irregularities of the electronic concentration of the plasma crossing the beam of the incident signal.
Close to the magnetic equator, for instance, scintillation has been linked with the equatorial anomaly [1]. Waves with frequencies up to 12 GHz can be affected by ionospheric scintillation [2]. Therefore, scintillation is of great concern for applications with high service availability such as GNSS. In addition to increasing the noise and reducing the accuracy of the estimated position of a user, it can lead to cycle slips, and even to the loss of the satellite-to-Earth link.
Hence, the study of scintillation is needed to understand the features of the phenomenon, linked with the atmosphere and the sun’s physics. Mention is made of different behaviors depending on latitude and longitude of the observation, but literature lacks global studies made in the African continent. However, Africa is the continent where civil aviation will experience the most important growth in the next 10 years. The emergence of satellite augmentation GNSS technologies, providing Safety-Of-Life aeronautic operations as they exist in North-America (WAAS), Europe (EGNOS), India (GAGAN) and Japan (MSAS) to assist users must take this destructive phenomenon into account.
Among the different patterns followed by scintillation, different studies have shown a clear dependence of frequency and intensity of scintillation with the sun’s activity (that can be quantified by Sun Spot’s Number) [3]. The cycle of the Sun’s activity, n°24, which was rather weak compared to the cycles 22 and 23, had its activity peak between 2013 and 2014, and ended in 2020. The next solar cycle’s maximum shall not happen before 2025, according to studies [4]. The SAGAIE stations that observed the Sub-Saharan West-African ionosphere from 2013 until present are hence a powerful tool to study the ionospheric scintillation in the scope of a characterization of the phenomenon.
Presentation of the SAGAIE Database
A network of GNSS stations deployed in the African equatorial region and measuring the ionospheric scintillation is an interesting way to measure the spatial and temporal dynamic of the ionospheric plasma. Indeed, the L-band is subject to the ionosphere’s variations while always crossing the medium. Therefore, the SAGAIE network seems perfectly adapted to analyze the turbulent ionosphere in this special area of the world.
SAGAIE is an acronym corresponding to Stations ASECNA GNSS pour l’Analyse de l’Ionosphère Equatoriale, or in English, GNSS ASECNA Stations for the Analysis of the Equatorial Ionosphere, where ASECNA stands for Agence pour la Sécurité de la Navigation Aérienne en Afrique et à Madagascar, or Agency for Air Navigation Safety in Africa and Madagascar. SAGAIE network is a cooperation between the French Space Agency CNES and ASECNA, financed by CNES and hosted by ASECNA. It was operated and maintained by Thales Alenia Space until 2021. It began its service in 2013. It will be further extended in the coming years and is operated by CNES since 2021. The accumulation of data since 2013 by SAGAIE enables a wide characterization of the ionospheric conditions observed since the peak of solar cycle 24. The aim of this network is also to challenge the robustness of GNSS algorithms, especially the ones embarked on aircraft equipped with SBAS (Satellite-Based Augmentation System) technology [5].
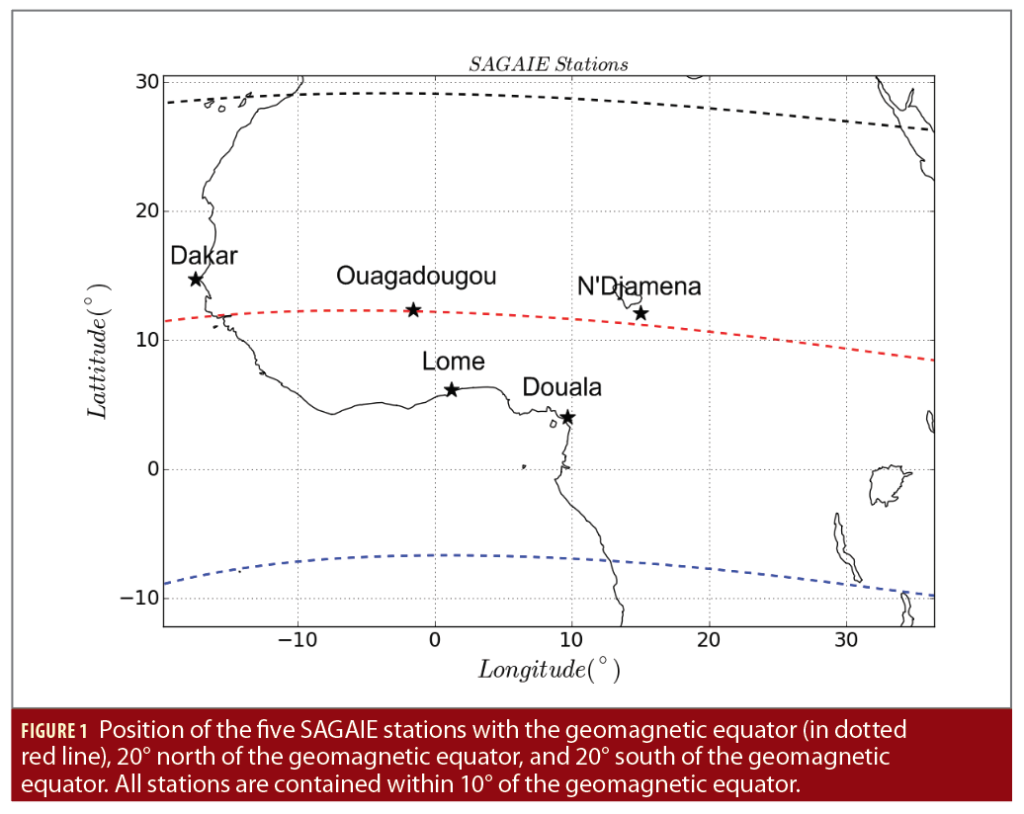
The SAGAIE network is composed of five stations in Western and Central Africa. The stations are located in Dakar (Senegal), Ouagadougou (Burkina Faso), N’Djamena (Chad), Douala (Cameroon), and Lome (Togo). Their positions are shown in Figure 1.
ASECNA premises host the stations. The use of such quality facilities prevents power outages and enables an internet link for real-time ionospheric analysis. The stations’ installation was preceded by a study phase that aimed to minimize the data corruption by undesired propagation effects such as ground multipath. The five SAGAIE stations were compared to the IGS (International GNSS Service) sites through a GPS bi-frequency signal quality check. The five stations were ranked among the best IGS stations in the world in terms of multipath [5].
Two kinds of receivers were used to collect SAGAIE GNSS data:
• A multi-frequency (whole L band), multi-constellation (GPS, GLONASS, Galileo, SBAS) scintillation monitor PolaRxS Pro ISM manufactured by Septentrio
• A multi-frequency (L1, L5, L2), multi-constellation (GPS, GLONASS, Galileo, SBAS) GNSS receiver FlexPak 6 OEM628 manufactured by NovAtel.
The Dakar and Lome stations are equipped with both receivers and a “choke ring” Septentrio antenna, whereas the other three stations are equipped only with the FlexPak 6 OEM628 NovAtel receiver. Ouagadougou, Douala and N’Djamena receive signals through a NovAtel A703 antenna.
The first observations made by the network show a strong link between the medium-to-strong scintillation events, and the satellites’ elevation observed from the stations, the equinoxes period and the hour of the day [5]. These observations are in line with previous results on the equatorial scintillation from the literature [6], [7].
In this paper, ionospheric scintillation is studied through the amplitude scintillation index S4 [8]:
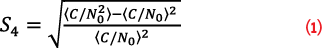
where < > refers to the average operator, performed on one minute of data. The signal intensity here is supposed to be given by the signal to noise ratio C/N0 [8]. C/N0 is here a vector, sampled at 1 Hz. It is obtained from the SAGAIE GNSS receivers through a Thales Alenia Space designed processor. Because the average operator is performed on one minute, for each S4 calculated using expression (1), 60 values of C/N0 are used in a nominal case. If the link is temporarily unavailable, and 20 values of C/N0 or less are processed, the S4 index status is set to unavailable so it does not fool the measurements.
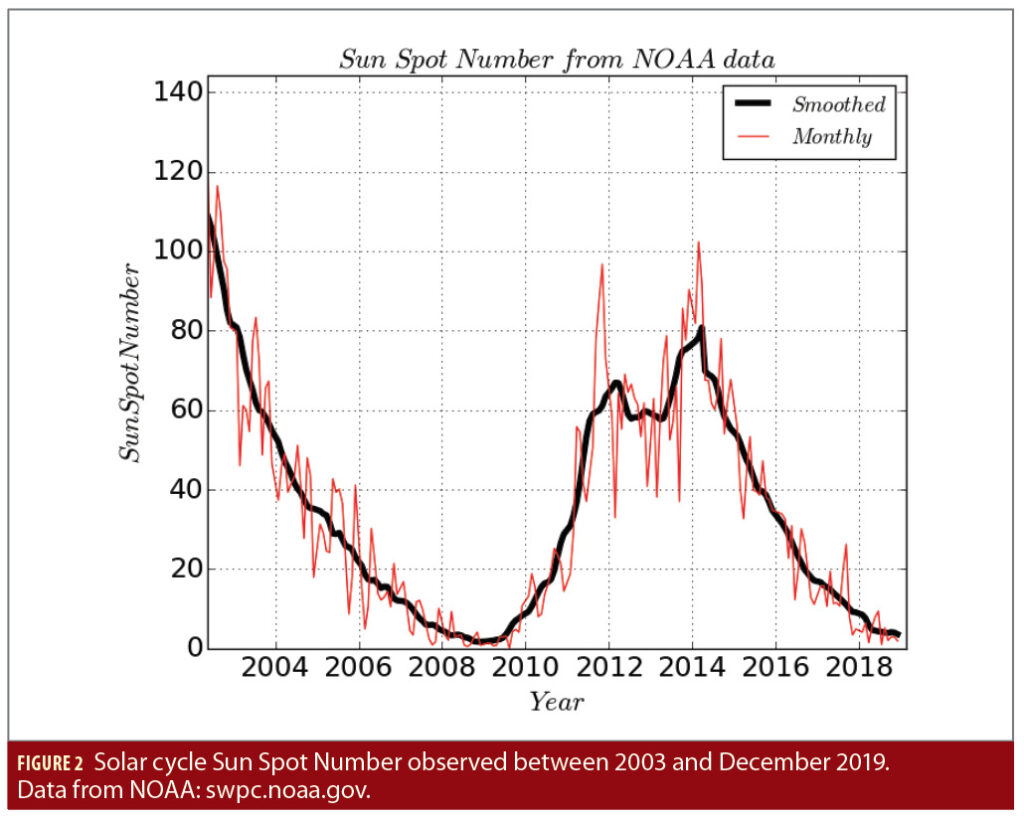
An elevation mask of 30° is usually applied in such studies to avoid ground multipath [9]. However, the favorable environment of the SAGAIE stations permitted a 15° elevation mask without being troubled by multipath or other undesired propagation effects, as shown by measurement quality analysis performed by Thales Alenia Space algorithmic core [10]. More line-of-sight can therefore be observed to characterize the medium. The period during which data were observed in this paper ranges from August 2013 to August 2016. As presented in Figure 2, this period was chosen to cover the maximum and decrease of solar cycle 24. The Sun Spot Number is used as a proxy for solar activity, [4] to be able to observe a possible variability of scintillation over the intensity of the solar activity [3].
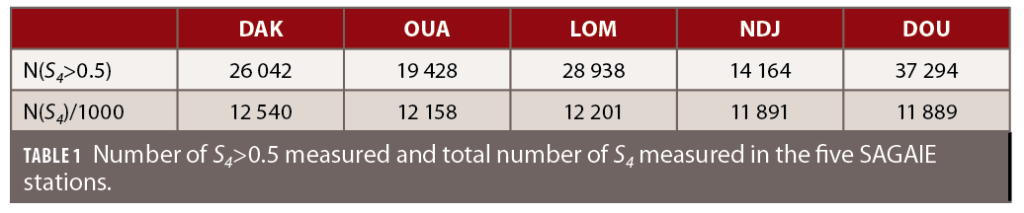
In total, more than 60 million S4 values have been calculated over the time frame selected. The repartition of those values between the five stations is presented in Table 1, as well as the number of S4 above a threshold of 0.5. There is a good balance of the number of S4 indices observed between the five stations; this will permit interesting comparative studies, which are conducted in the following sections.
The number of S4>0.5 is quite significant: between 14,000 and 37,000, depending on the stations, (S4>0.5 is characteristic of medium-to-strong scintillation events [9], [2]). This denotes a variable state of the ionosphere during the time of observation between steadiness and turbulence. The next sections will also focus on describing those variations.
Temporal Study of the S4 Index
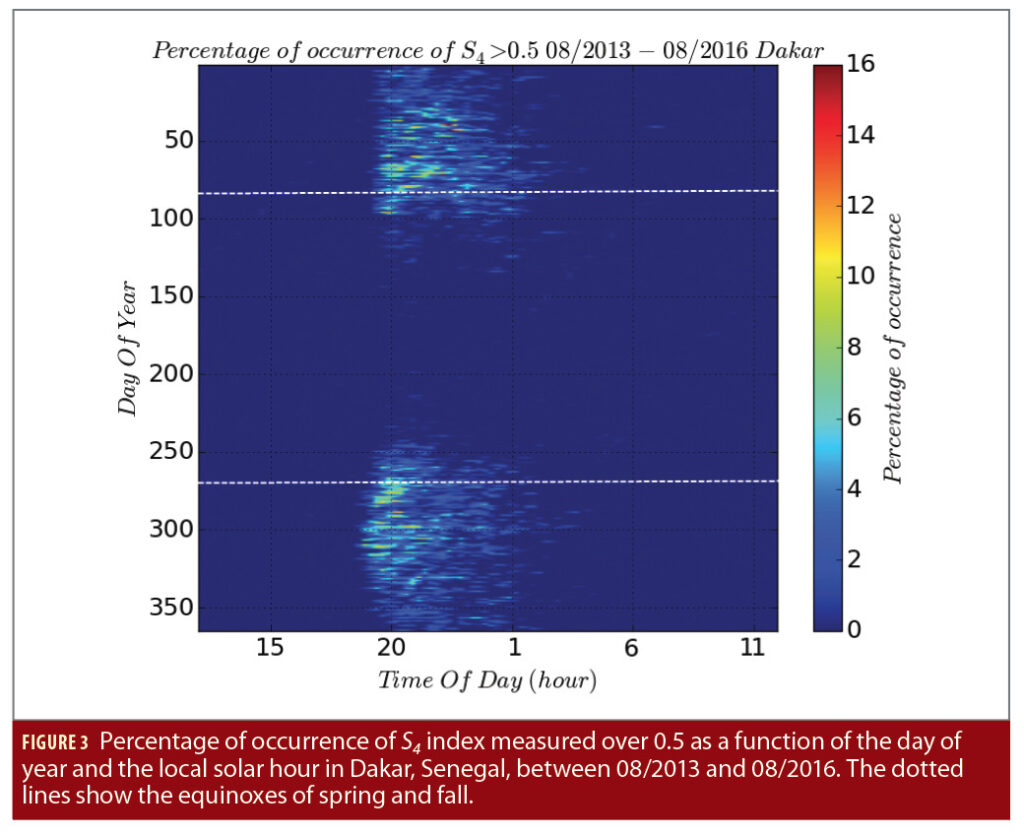
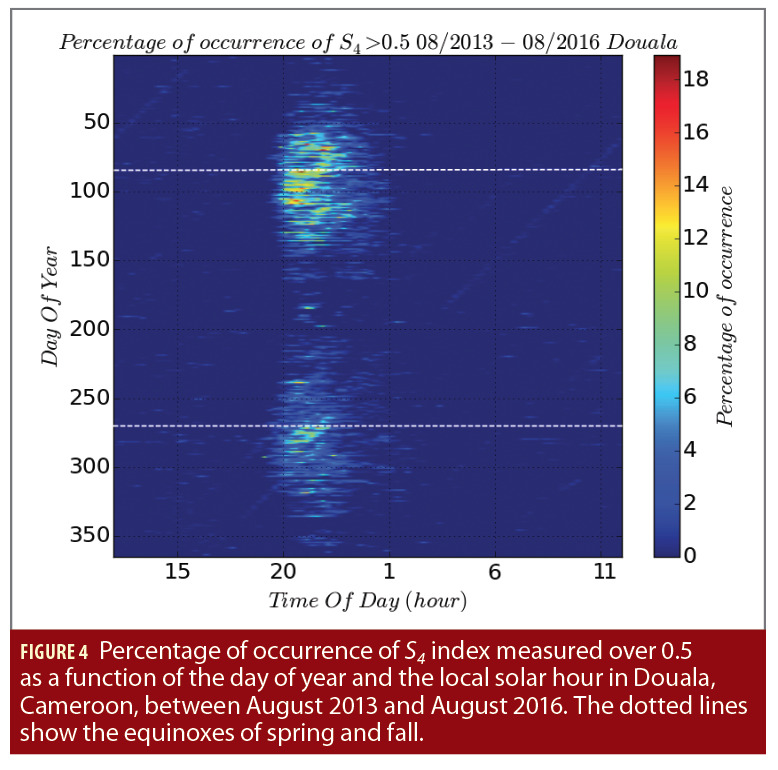
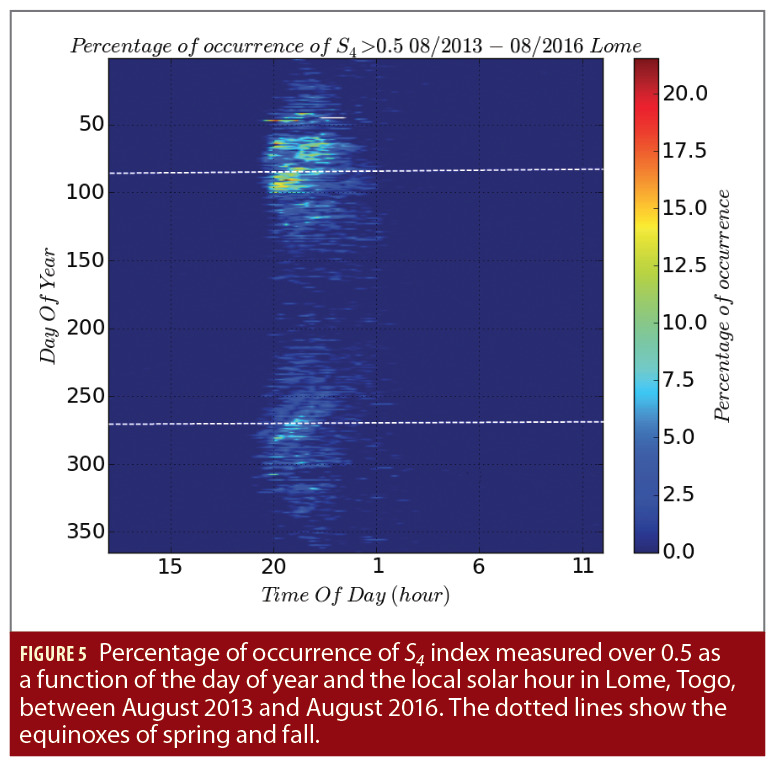
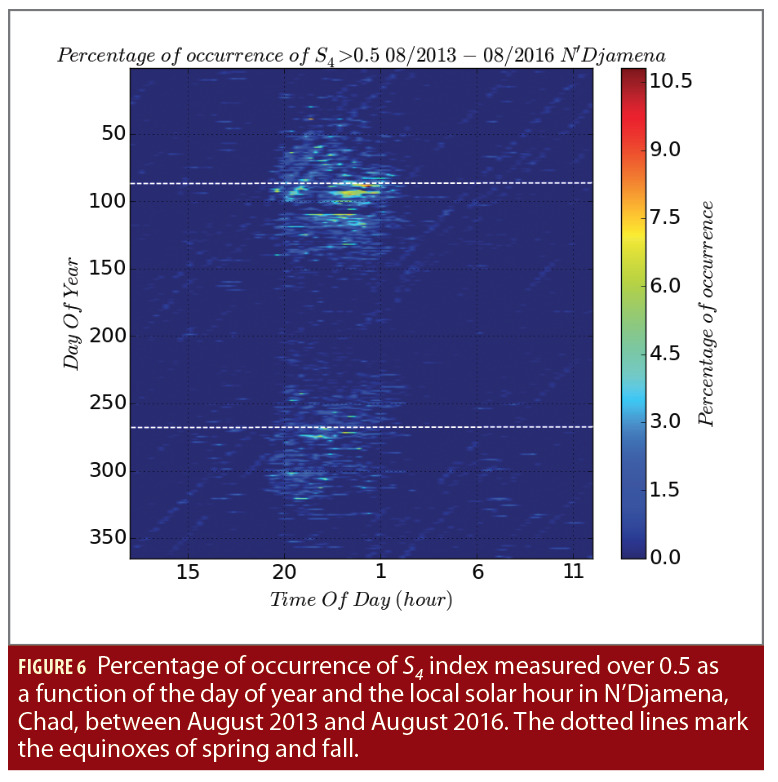
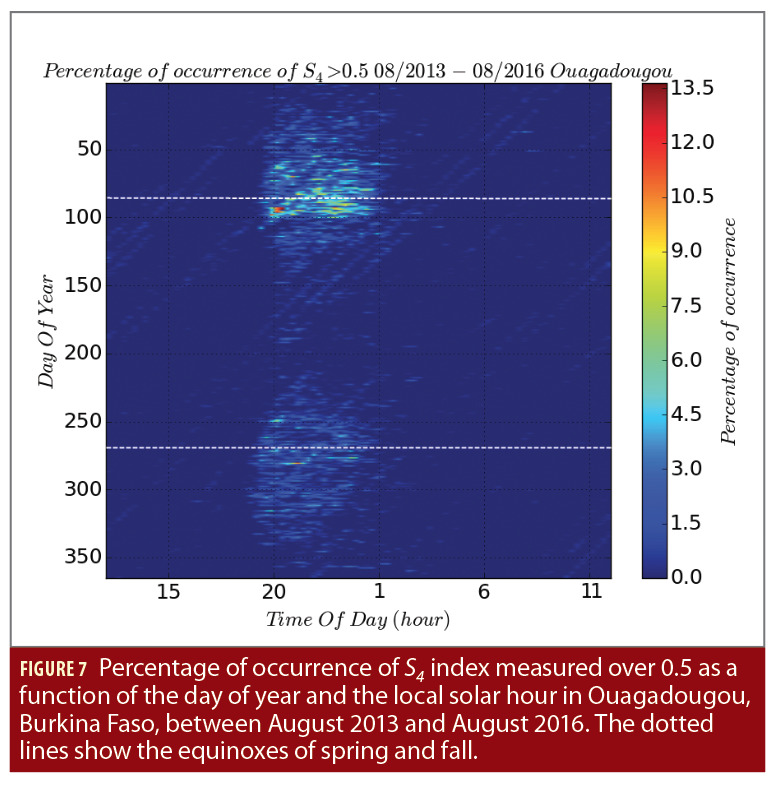
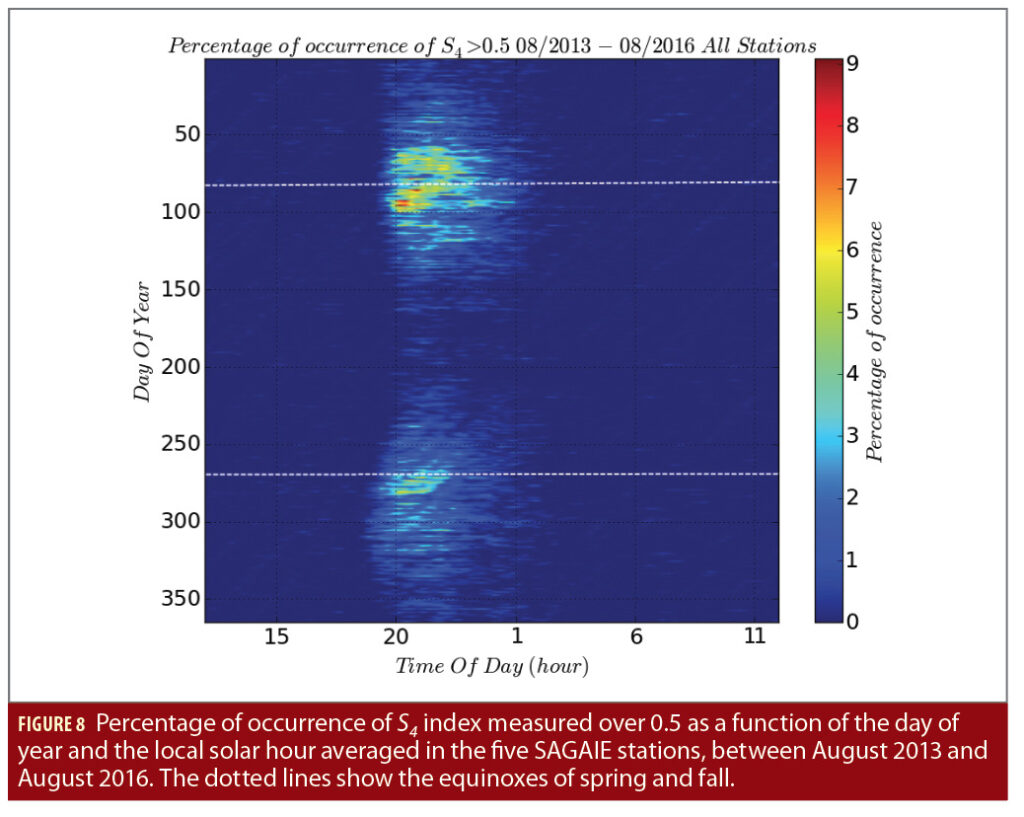
This refers to the temporal variability of the S4 index on the West-African Sub-Saharan region. Figures 3 through 7 show the percentage of occurrence for S4 to be observed above the threshold 0.5, against the hour of the day in local time (x-axis) and the day of the year (y-axis) for the five SAGAIE stations. In Figure 8, the same quantity is represented, but averaged on the five SAGAIE stations. The value of S4>0.5 usually denotes a scintillation that can severely impact the GNSS systems [11],[12]. This study refers to medium-to-strong scintillation events.
A global tendency is observed and common to all stations: ionospheric scintillation appears around 8 p.m. solar time (i.e. 20h), and disappears around 1 a.m. solar time (i.e. 1h). The peaks of scintillation occurrence are observed during or close to the equinoxes, in agreement with what was previously reported in the literature [6],[7]. In Figure 8 (an average calculation of Figures 3 through 7), we remark that scintillation extracted from the SAGAIE measurements seems more frequent and more intense close to the spring equinox than close to the fall equinox. The dissymmetry between the two equinoxes is particularly well marked in Figure 4 from Douala and Figure 5 from Lome and can be distinguished in Figure 6 in N’Djamena and Figure 7 from Ouagadougou.
However, scintillation characteristics linked with the latitude and the longitude seem to differ for the five stations. In N’Djamena in Figure 6 and Ouagadougou in Figure 7, ionospheric scintillation appears before 8 p.m. and ends slightly after 1 a.m., whereas in Lome in Figure 5 and in Douala in Figure 4, scintillation ends before 1 a.m. In Dakar in Figure 3, scintillation starts earlier, around 7 p.m., and ends after 1 a.m. Hence, the phenomenon lasts globally longer than in the other stations.
The phenomenon seems to last less in the two stations closer to the magnetic equator (Ouagadougou and N’Djamena), while the duration is the longest in Dakar. Ionospheric scintillation observed through SAGAIE therefore shows more frequent and intense amplitude scintillation from the stations close to the equatorial crests, between 5 and 15 degrees of latitude north and south of the magnetic equator.
These conclusions can be partially retrieved through the analysis of Table 1. The number of S4 measured is similar for all stations (it is not exactly the same due to both the visibility of the satellites in the sky and the punctual loss of internet network resulting in minor data loss), the N’Djamena and Ouagadougou stations have less S4>0.5 than the others. It confirms the conclusions previously stated, showing that the scintillation in those places close to the magnetic equator is less intense than in Douala, where there are twice as many events for which S4>0.5.
Figure 4, referring to Douala, shows the percentage of occurrence of S4>0.5 is close to 20% during equinoxes, with a great duration in time, something neither observed in Ouagadougou nor in N’Djamena. The number of scintillation events for which S4>0.5 is also greater in Dakar and Lome than in N’Djamena and Ouagadougou, showing a higher presence of medium-to-strong scintillation events in those places. Those are some hints of the geographical characteristics of the equatorial scintillation.
Spatial Study of the S4 Index
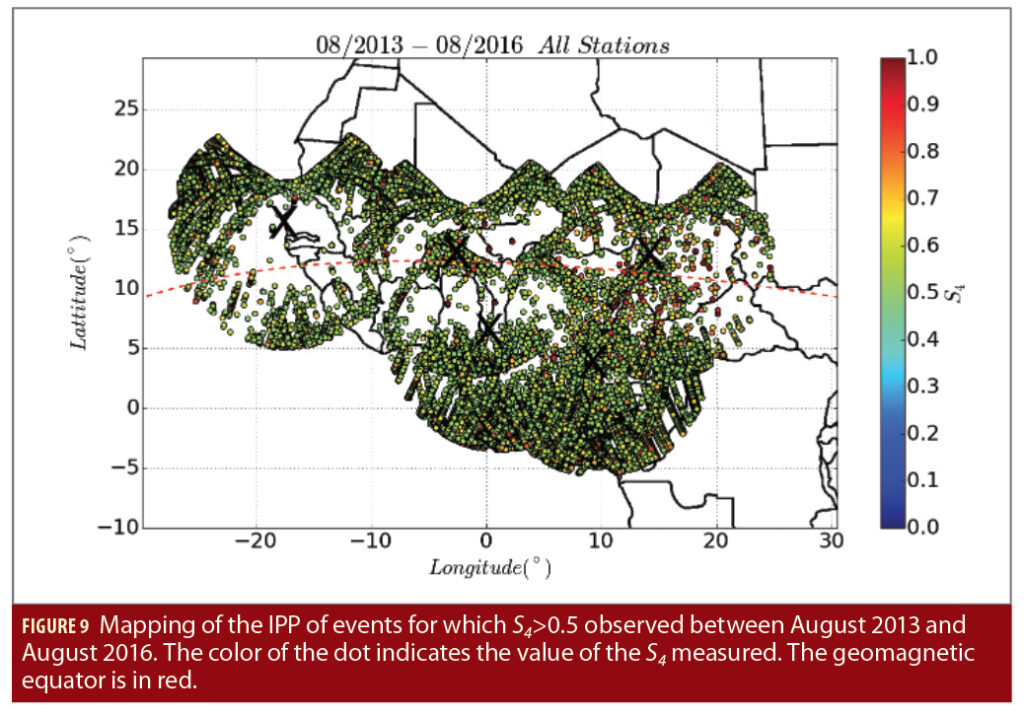
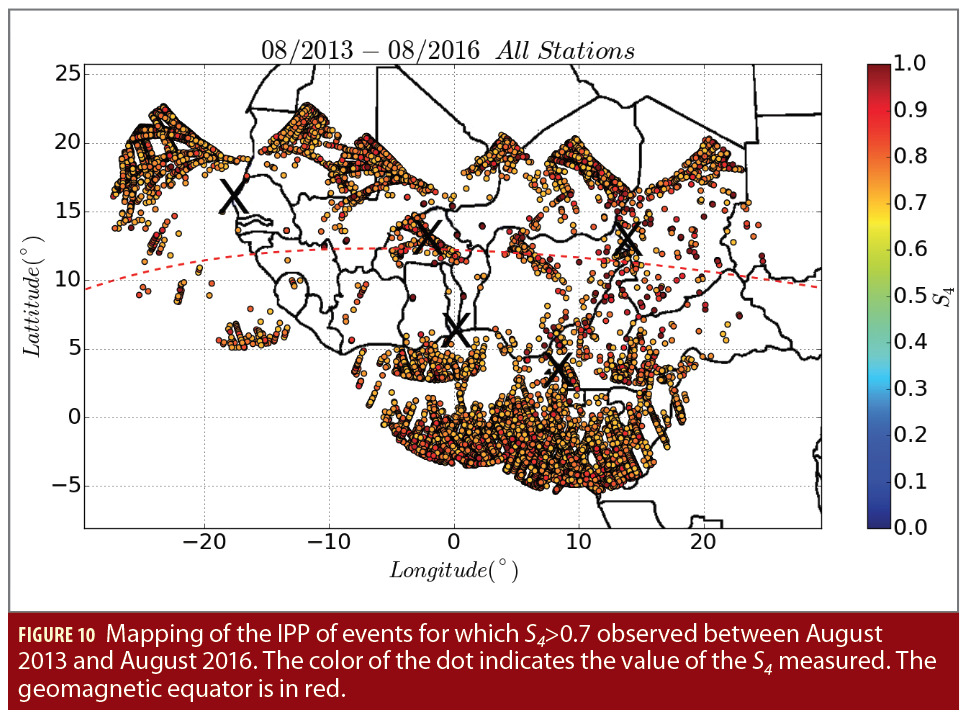
The mean IPP (Ionospheric Pierce Point, calculated at a height of 400 km) of the events for which S4 has been measured over the thresholds 0.5 and 0.7 are shown in Figures 9 and 10, respectively. The color of the point shows the measured value of S4 with respect to the adjacent color bar. The position of the geomagnetic equator is represented in a dotted red line in the two figures. The locations of the SAGAIE stations are highlighted by black crosses. More than 125,000 events are displayed in Figure 9, and 25,000 are displayed in Figure 10, showing the significant number of medium-to-strong scintillation events. Those two figures show the geographical positions of the places where medium-to-strong (threshold on S4 of 0.5) and strong (threshold on S4 of 0.7) ionospheric scintillation has been observed.
In Figure 9, it is common to notice events for which S4>0.5 is close to the geomagnetic equator, even though most of the events are north and south of this line. In Figure 10, the vast majority of the events are located north and south of the geomagnetic equator. The location of these strong scintillation events shows the presence of well-marked equatorial crests between latitudes 15° and 20° (north crest) and -5° and 5° (south crest). As discussed earlier, the Douala station contributes well to the observation of strong scintillation; this station is the furthest away from the geomagnetic equator, and the majority of the events for which S4>0.7 have been observed from there.
These equatorial crests observations are in agreement with the common description of scintillation apparition, linked with the phenomenon of equatorial fountains [13], [14].
Events of moderate-to-strong scintillation appear east and west of SAGAIE stations Dakar, Ouagadougou and N’Djamena in Figure 9. Those places do not belong to the equatorial crests and should therefore not be subject to strong scintillation. However, it is known the S4 index is inversely proportional to the elevation angle [15], [16]. This effect then contributes to increasing the S4 indices at low elevations. However, a partial decorrelation of the scintillation (particularly the S4 index) and the elevation angle under which the signal is received can be seen.
Indeed, there are only a few strong scintillation events located east and west of the SAGAIE stations in Figure 10, whereas many events are seen north and south of the stations (i.e. located on the equatorial crests), though they are seen with the same elevation as the east and west events.
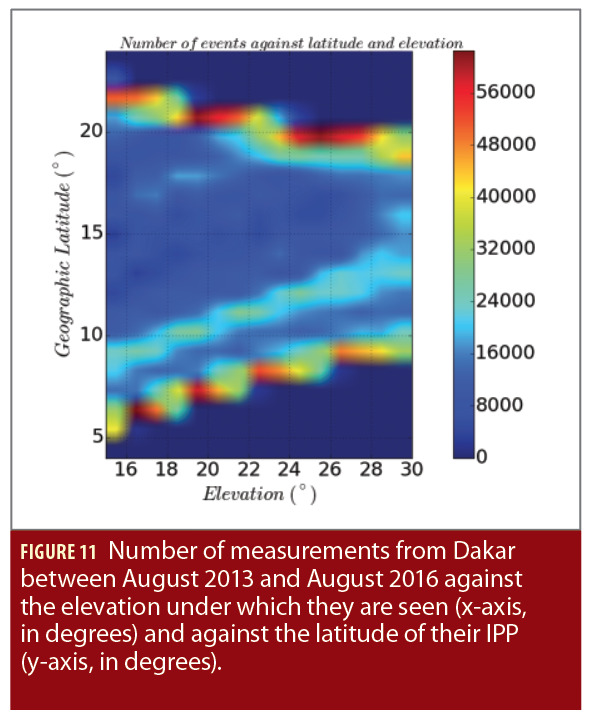
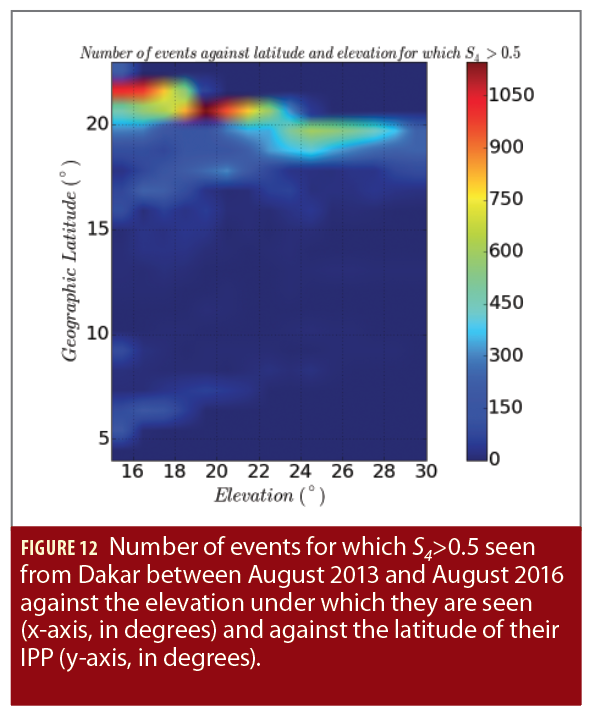
Focusing only on the Dakar station, Figure 11 shows the number of S4 measurements against their elevation seen from Dakar (x-axis) and the latitude of their IPP (y-axis), while Figure 12 represents the same quantity, but only for events having S4>0.5, respectively.
Figure 12 clearly shows, between elevations 15° and 30°, more events at high latitudes (15° to 23° north) than at low latitude (below 10°N), whereas Figure 11 shows the number of IPP in sight is approximately the same for low and high latitude under those elevations. The north equatorial crest is roughly located between 15° and 25° north in Dakar, whereas no crest is present between 5° and 15° north. This clearly shows a dependence of scintillation to the equatorial physics, and not only in the elevation.
Scintillation and Solar Cycle
Another major feature of the scintillation impacting both the geographical distribution and temporal occurrence of the event was observed through SAGAIE. This is the dependence of the scintillation with the solar cycle.
From Figure 2, it is possible to notice that the highest peak of solar cycle 24 occurs at the beginning of the year 2014, while 2016 is a year counting a Sun Spot Number three times lower in average and is therefore a weaker year.
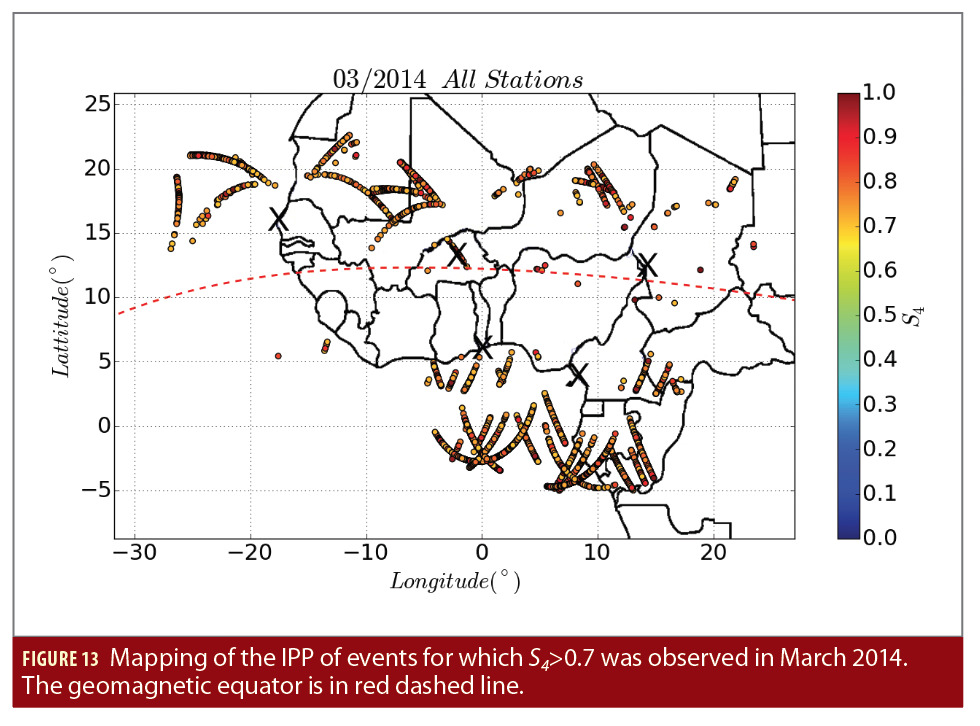
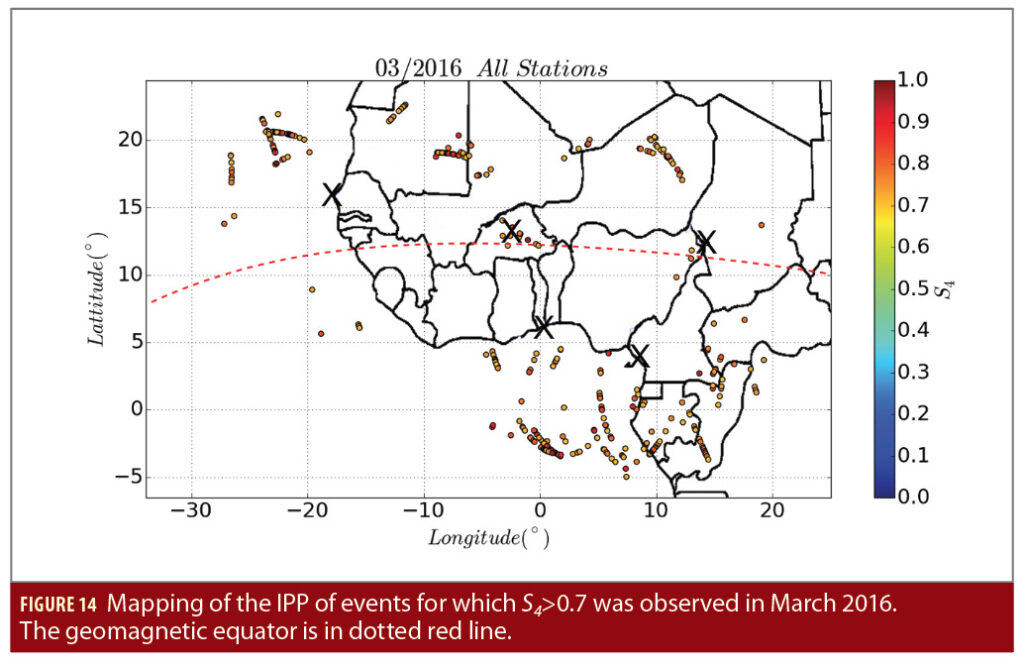
The mean IPP of the events for which S4 has been measured over the thresholds 0.7 are shown in Figure 13 for March 2014 and in Figure 14 for March 2016. The color of the point shows the measured value of S4 with respect to the adjacent color bar. The position of the geomagnetic equator is represented in the red dashed line. The locations of the SAGAIE stations are highlighted by black crosses. As shown earlier, March is a month of strong scintillation for the SAGAIE network.
The conclusions of the previous section on the elevation and geographical position of the IPP also can be inferred from Figures 13 and 14. Clearly, fewer strong scintillation events (i.e. S4>0.7) were observed in March 2016 (337) than in March 2014 (2,804). March 2014 had over 13 times more events than March 2016, in fact. Ionospheric scintillation, and in particular events apt to severely influence GNSS signals, clearly depend on solar activity.
It is then useful to recall that SAGAIE data measurements began in 2013; the study of scintillation presented in this paper hence globally refers to a weak solar cycle (24) when it is compared to solar cycles 22 or 23 [4]. Therefore, the conclusions of the frequency and intensity of ionospheric scintillation events might be under-estimated compared to the two previous solar cycles. The levels of ionospheric scintillation observed could have been drastically increased if the data had been measured during solar cycle 22, for instance, when the peak counted Sun Spot Numbers two times higher in average than the peak of solar cycle 24.
Conclusion and Look to the Future
The SAGAIE database is a useful tool to study the turbulent equatorial ionosphere in Western and Central Africa, a region of the world where the scintillation phenomenon has not been as well characterized as in South America or South-East Asia ([7], [17] among others), although it appears to have specificities.
After presenting the SAGAIE network and the context in which the SAGAIE database was collected, the impact of the ionospheric scintillation on the GNSS signal’s amplitude characterized through the S4 index has been studied in detail. The temporal variability of this index indicates a scintillation apparition cycle depending on the hour of day and the day of year.
Those findings are similar to what was observed in the literature in South Asia or South America: scintillation is mainly present close to equinoxes (especially the spring one), and mainly absent during solstices for the peak of solar cycle 24. Some events are, however, reckoned close to the winter solstice. In terms of hourly variations, scintillation appears at the end of the afternoon (between 6:30 and 8 p.m. UTC), weakens, and then disappears in the middle of the night (between 11:30 p.m. and 2 a.m. UTC).
The geographical variability of the medium and strong scintillation draws crests between 5° and 15° north and south of the geomagnetic equator, typical of the equatorial phenomena, especially in terms of plasma dynamic. It has been shown that low elevation, although it is naturally a factor of S4, is not sufficient to observe strong scintillations; they can only be physically explained through the process giving birth to the equatorial crests.
Finally, the impact of solar activity on scintillation is observed. SAGAIE covers the peak and the decreasing part of a weak solar cycle. The scintillation strength as well as its occurrence probability may increase in the case of a strong solar cycle observation.
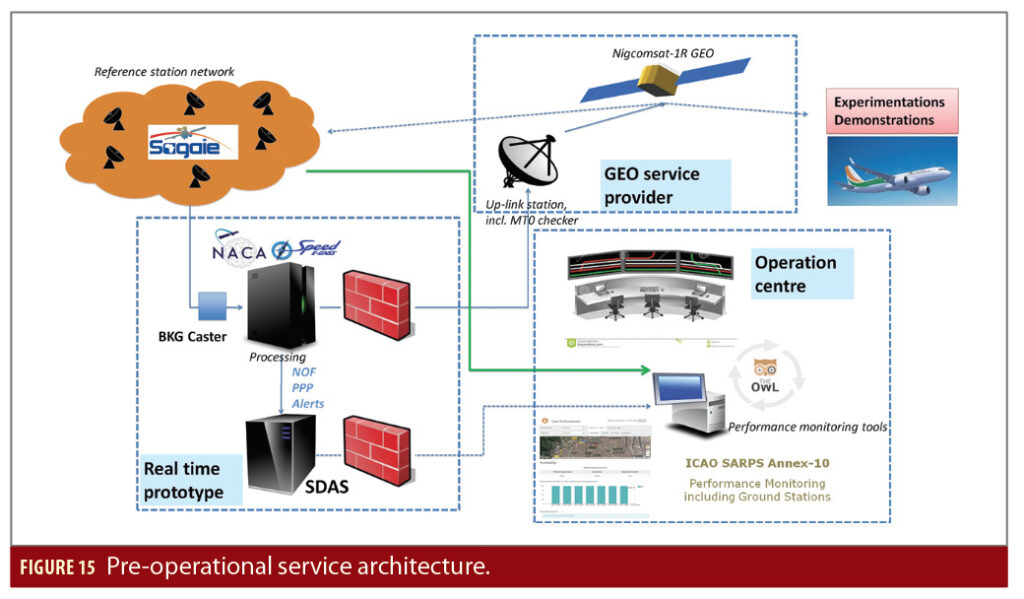
The objective of this work was to make a stenography of ionosphere turbulence in the sub-Saharan zone and to assess whether the scintillation phenomenon could be a blocking point to developing the A-SBAS. Experimental results had indicated this is not the case. Following this, between 2019 and 2021, ASECNA managed the definition and preliminary design phase of its program awarded to Thales Alenia Space. This phase addressed technical and technological feasibility issues related to System Architecture, System Performances, RAMS, IVV, Safety, deployment, operation and maintenance topics. On this occasion, the engineering team of Thales Alenia Space developed an Equatorial Navigation Kernel (NACA solution) that provides satisfying performances. These performances were validated on the field in 2020 using a real-time demonstrator broadcasting in Western African an SBAS augmentation signal compliant with the ICAO SARPs and RTCA MOPS standard.
This demonstrator, whose architecture is illustrated in Figure 15, collects GNSS data through a set of stations in Western and Central Africa encompassing the SAGAIE and MONITOR network, augmented by some other stations coming from the REGINA network, and feeds the navigation kernel that processes in real-time conditions. The navigation message is thus sent to an uplink station that broadcasts the signal to the Nigcomsat 1-R payload, the Nigerian GEO telecommunication satellite. System performances are continuously monitored using TheOwl GNSS monitoring service developed by PildoLabs.
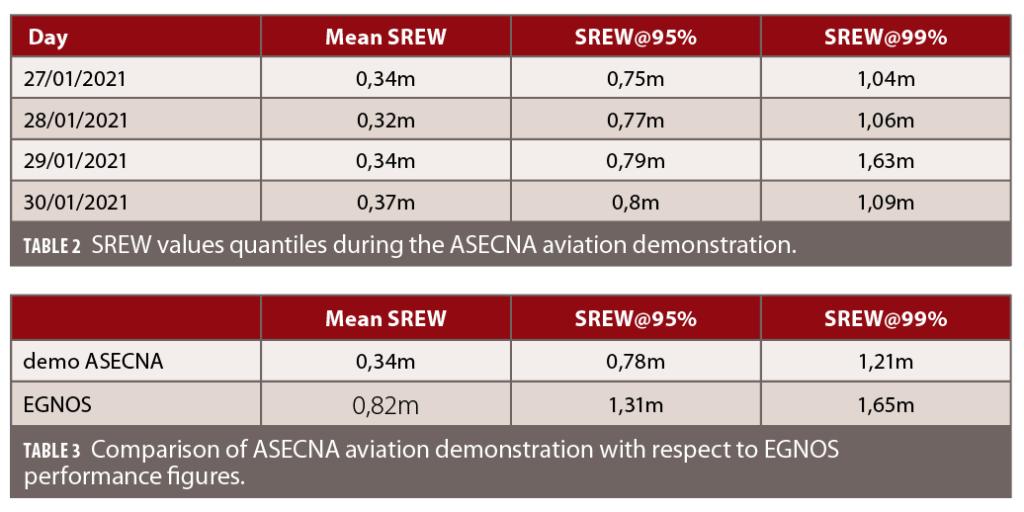
In January 2021, ASECNA conducted several demonstration flights at Lome airport (Togo) to showcase the performance of the real-time A-SBAS signal to perform SBAS precision approaches and landing procedures. These demonstration flights have proven the efficiency of the A-SBAS augmentation message and its great added-value for air navigation, in particular for approaches to main and secondary African airports that are not served by a conventioanl Instrument Landing System (ILS).
To illustrate these performances, Tables 2 and 3 provide the worst user pseudorange projected error (SREW) during the four days of experimentations. The SREW contains the unmodeled satellite and clock error of the augmented navigation message.
In comparison to EGNOS, over the same period, the performance provided by the ASECNA aviation demonstration is very satisfying.
Beside these activities, Thales Alenia Space has developed a new Navigation Kernel compliant to dual-frequency multi-constellation (DFMC) standard messages. Based on these new algorithms, whose performance in fault-free and feared event present a very good behavior in terms of not modeled residual error distribution [18], and a proven operational demonstrator capability already available for single frequency SBAS service, Thales Alenia Space has been awarded a contract by CNES to develop a DFMC satellite-based augmentation system (SBAS) prototype with the objective to demonstrate the service in Africa with a L5/E5 augmented signal.
Acknowledgments
The authors would like to thank Damien Serant and Xavier Berenguer from Thales Alenia Space for the help they brought to the data computing. They also thank ASECNA for hosting the SAGAIE stations that produced the raw measurement used in this paper and CNES for making this particularly valuable GNSS data collection possible.
References
(1) Rishbeth, H., 1997, The ionospheric E-layer and F-layer dynamos–a tutorial review, Journal of Atmos and Solar-terrestrial physics, vol.59, no 15, pp 1873-1880, DOI: 10.1016/S1364-6826(97)00005-9.
(2) ITU recommendation, Ionospheric propagation data and prediction methods required for the design of satellite networks and systems, P series radiowave propagation, August 2019.
(3) Fejer, B. G., de Paula, E . R., Gonzalez, S. A., Woodman, R . F., 1991, Average vertical and zonal F region plasma drifts over Jicamarca , Journal of geophysical research, vol.96, no A8, pp 13901-13906, DOI: 10.1029/91JA01171.
(4) Bhomik, P., Nandy, D., 2018, Prediction of the strength and timing of sunspot cycle 25 reveal decadal-scale space environmental conditions, Nat Commun 9, 5209 (2018), DOI: 10.1038/s41467-018-07690-0.
(5) Secretan, H., Rougerie, S., Ries, L., Monnerat, M., Giraud, J., Kameni, R., 2014, SAGAIE a GNSS network for investigating ionospheric behavior in sub-saharan regions, InsideGNSS pp 46-58, issue September/October 2014.
(6) Aarons, J., 1993, The longitudinal morphology of equatorial F-layer irregularities relevant to their occurrence, Space science reviews, vol.63, issue 3-4, pp 209-243, DOI: 10.1007/BF00750769.
(7) Moraes, A. O., Costa, E., Abdu, M. A., Rodrigues, F. S., de Paula, E. R., Oliveira, K. and Perrellan, W. J., 2017, The variability of low-latitude ionospheric amplitude and phase scintillation detected by a triple-frequency GPS receiver, Radio Sci., 52, 439–460, DOI: 10.1002/2016RS006165.
(8) Van Dierendonck, A. J., Klobuchar, J., Quyen, H., 1993, Ionospheric Scintillation Monitoring Using Commercial Single Frequency C/A Code Receivers, Proceedings of the 6th International Technical Meeting of the Satellite Division of The Institute of Navigation (ION GPS 1993), Salt Lake City, UT, pp. 1333-1342.
(9) Mushini, S. C., 2012, Characteristics of scintillating GPS signals at high latitudes during solar minima, Ph.D. thesis from University of New Brunswick.
(10) Foucault, E, Blelly, P-L, Marchaudon, A., Serant, D., Trilles, S., 2018, Equatorial Ionosphere Characterization for Sub-Saharan Africa SBAS, 31st ION GNSS+ 2018, 24 September 2018 – 28 September 2018, Miami, United States pp.2222-2240. hal-01915098.
(11) Rama Rao P. V. S., Gopi Krishna S., Niranjan, K., Prasad, D. S. V. V. D., 2006. Study of spatial and temporal characteristics of L-band scintillations over the Indian low-latitude region and their possible effects on GPS navigation, Annales Geophysicae, European Geosciences Union, 2006, 24 (6), pp.1567-1580, DOI: 10.5194/angeo-24-1567-2006.
(12) Guo, K., Aquino, M., Vadakke Veettil, S., 2019, Ionospheric scintillation intensity fading characteristics and GPS receiver tracking performance at low latitudes, GPS Solutions (2019) 23:43, DOI: 10.1007/s10291-019-0835-1.
(13) Klobuchar, J. A., Anderson, D. N., Doherty, P. H., 1991, Model studies of the latitudinal extent of the equatorial anomaly during equinoctial conditions, Radio Science, vol.26, no4, pp 1025-1047, DOI: 10.1029/91RS00799.
(14) Blelly, P.-L., Alcaydé, D., 2007, Ionosphere, in Kamide, Y., Chian, A., 2007, Handbook of the Solar-Terrestrial Environment, Springer-Verlag Berlin Heidelberg, pp. 189-220.
(15) Rino, C. L., 1979, A power law phase screen model of ionospheric scintillation, 1. Weak scatter, Radio Science, vol. 14, n°6, pp. 1135-1143, DOI: 10.1029/RS014i006p01135.
(16) Galiègue, H., L Féral, and V. Fabbro, 2016, Validity of 2-D electromagnetic approaches to estimate log-amplitude and phase variances due to 3-D ionospheric irregularities, J. Geophys. Res. Space Physics, 121, DOI: 10.1002/2016JA023233.
(17) Ji, S., Chen, W., Weng, D., Wang, Z., 2015, Characteristics of equatorial plasma bubble zonal drift velocity and tilt based on Hong Kong GPS CORS network: from 2001 to 2012, Journal of geophysical research space physics, vol. 120, pp 7021-7029, DOI: 10.1002/2015JA021493-T.
(18) T. Authié, C. Bourga, J. Samson, M. Dall’Orso, 2022, Analysis of the Position and Pseudorange error distributions and autocorrelation functions of a DFMC SBAS, Navitec 2022.
Authors
Aurélien Galmiche graduated from l’École Nationale de l’Aviation Civile in Toulouse (M.Sc.Eng., 2015), and obtained his Ph.D. from Université de Toulouse III (2019). He was hired in 2018 as a Navigation Engineer at Thales Alenia Space, where his research topics focus on ionosphere and integrity monitoring.
Vincent Fabbro is a doctor in microwave propagation. He is currently a research engineer at ONERA, Toulouse. His areas of interest are focused on the modeling of propagation over the sea, interactions of micro waves in the troposphere and the associated attenuations. He also worked on transionospheric propagation with quantification of scintillation effects, including modeling and prediction, especially on GNSS signals.
Laurent Féral received the Ph.D. degree in propagation and active remote sensing of the atmosphere from the University of Toulouse (UT3), France, in 2002. Since 2005, he is Assistant Professor with UT3. In 2020, he joined the Laboratoire d’Aérologie (Observatoire Midi-Pyrénées, Toulouse, France). His main research interests are the modelling of the micro-wave propagation in the atmosphere for telecommunication, GNSS and remote sensing applications.
Sébastien Trilles is a doctor in mathematics, expert engineer in navigation at Thales Alenia Space and teaches space mechanics at the Federal University of Toulouse Midi Pyrénée. He heads the Performance and Processing department where high precise algorithms are designed as the navigation, integrity and ionosphere modelling algorithms of SBAS systems, the orbitography solutions and the composite time reference generation for Galileo.
Sebastien Rougerie graduated from the French national civil aviation school ENAC with an engineer diploma and obtained a master of science degree from the University of Toulouse. He received a Ph.D. degree in array processing from ISAE Toulouse. From 2012 to 2014, he worked for AUSY as a research engineer on behalf of ONERA and Thales Alenia Space. From May 2014 to September 2021, he lead the propagation department at the French national space agency CNES. His research concerned propagation channels measurements and modeling (ionosphere, troposphere, multipath, optic), for space transmissions including GNSS. Since September 2021, he works at Thales Alenia Space as an expert engineer on signal and array processing for space link transmission.
Julien Lapie is a civil aviation engineer, graduated from the French Civil Aviation University (ENAC), Toulouse (France), in 2001. He currently serves at ASECNA as Advisor to the Director of Air Navigation Services and as A-SBAS Programme Manager. He is the ICAO Navigation Systems Panel (NSP) member nominated by ASECNA.
Louis Bakienon is a civil aviation engineer, graduated from the African University of Civil Aviation and Meteorology (EAMAC) in Niamey (Niger) in 1989. He also received a MBA degree from Paris Dauphine University in 2008. He currently serves as the Director of Air Navigation Services of this Agency, directing the SBAS programme.