Return to main Working Papers article: "Peer-to-Peer Cooperative Positioning: Part II"
Return to main Working Papers article: "Peer-to-Peer Cooperative Positioning: Part II"
Least squares, Kalman filter and particle filter are very well known concepts in the GNSS community. Hybrid cooperative versions of these algorithms can be found in the publications by the Politecnico di Torino (all three algorithms), G. Heinrichs et alia (least squares), M. A. Caceres (least squares and unscented Kalman filter), M. A. Caceres et alia (2010) (unscented Kalman filter), and F. Sottile et alia (particle filter), cited in the Additional Resources section at the end of this article. The application of the sum product algorithm to positioning is quite innovative for GNSS scenarios and it is worthwhile to spend a few moments introducing it.
Let us denote by
s(k)m = (xm, ym, zm, bm)(k)
the joint Position-Time state vector at time k of the user m, composed by its three coordinates (xm, ym, zm) and the receiver clock error (expressed in distance units by multiplying the clock bias δm by the speed of light: bm = cδm).
The key point of the hSPAWN algorithm is the factor graph representation (for an introduction to factor graphs, see the articles by H. Loeliger and F. R. Kschiaschang et alia).
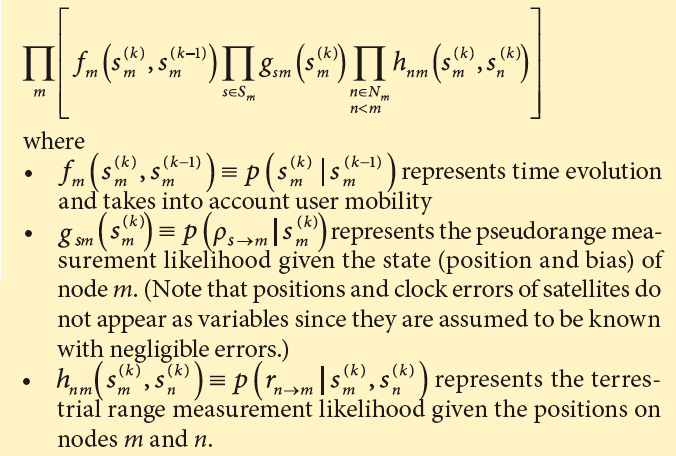
The joint a posteriori probability of the state vectors of all users can be expressed as a function of
(See equation: inset photo, above right)
The resulting factor graph representation is depicted in Figure A-1 (at the top of this article). Each node elaborates information from the past regarding its last position estimation (factor f), and receives messages from its visible satellites (factor g) and its neighbors (factor h), updates its position estimation and shares it with its neighbors. Dashed boxes represent physical nodes, i.e., messages inside a box are computed internally by a node. Factors connected to pairs of nodes imply packet exchanges.
Any cooperative network can be easily mapped into a corresponding factor graph. As an example, Figure A-2 (at the top of this article) shows the factor graph representation for the network of Figure 1.
Messages exchanged among nodes represent probability density functions. However, a high-resolution sample-based representation of these functions would not be viable in real systems due to the amount of data to be transferred. For this reason, an efficient parametric message representation has been developed: all distributions were categorized into a limited set of distribution families, characterized by certain parameters (See the P2P positioning report and the publication by M.A.Caceres et alia [2011]).
The problem then reverts to finding the parameters of the output distribution that best approximate the product of the incoming parametric messages. This way, the exchanged messages ultimately consist only of a vector of a few parameters, dramatically reducing both complexity and communication overhead.
More details on the hSPAWN algorithm, its message representation, and its complexity can be found in the article by M. A. Caceres et alia (2011).