Return to main article: "Winging It"
With high-quality data sets obtained in the foot-to-foot configuration, we set about on postprocessing the data to extract more information about the NovAtel wingsuit system’s performance in the free-fall environment.
This was a multi-step process involving several NovAtel utilities and techniques, which we will describe here.
Step 1:
Video Time-Synchronization
Each jump was videotaped by an in-air videographer. In order to correlate effects observed in the data with real-world dynamics seen on the video (including such important events as time of the jump itself), we created a very simple synchronization method.
After the videographer had begun filming during the airplane’s flight up, he shot a short sequence of our wingsuit flyer, Andrew Levson, hitting a key on the collection PC to create a time mark in the GPS data itself. At this point, the data PC output an obvious visual cue (a color change), which was then correlated with the GPS time mark in post-mission analysis.
For the rest of the jump, the video was run continuously with events measured from the synchronization mark. Using this method, we fairly easily correlated several events in the video with obvious changes in dynamics.
Step 2:
Base Station Coordinates
Our static base station at the Innisfail Airport collected data for approximately 12 hours continuously during the event day. To use it as a reference station for the individual jumps, we needed to determine its coordinates as precisely as possible.
We used GrafNav, a NovAtel product from our Waypoint Products Group, in PPP (precise point positioning) mode, accessing downloaded precise satellite ephemeris and clock information to estimate a position. The long (12-hour) data set, combined with precise post-mission information, yielded a base station estimate accurate to approximately two centimeters or better, based on the solution standard deviation. Given that this is roughly two orders of magnitude better than typical single-point accuracy, we deemed it accurate enough to serve as a reference position for further postprocessing.
Step 3:
Aerial “Truth” Trajectories
In our wingsuit application, we lack a defined “truth” to compare against. To get our best possible estimate, though, we processed the raw range data collected by each airborne receiver (at 20 hertz) in differential mode with GrafNav. This software resolves carrier-phase ambiguities in much the same way as a real-time kinematic (RTK) application, but it processes the data both forwards and backwards to improve ambiguity resolution in the case of outages.
Using GrafNav, we were able to obtain a roughly centimeter-level of accuracy for each receiver for the majority of each flight (except as limited by data outages). Obviously the raw range data used to create the GrafNav “truth” is the same as that used to generate the real-time single-point solution; so, the two trajectories are fundamentally correlated.
However, the addition of fixed base station data to the GrafNav solution allows us to detect and reject any major blunders in range data. With this, we are confident that those GrafNav solutions identified as having fixed-integer ambiguities are, in fact, correct to within about two centimeters. Howevers, the uncertainty in the base station position (± two centimeters) is still a factor.
“Truth”
Heading/Pitch
As with the single-point position, we also lack truth data for receiver-to-receiver heading and pitch.
We do have two methods to obtain semi-independent estimates of “truth” heading/pitch, though. The first is to use a difference
of postprocessed GrafNav solutions (discussed previously). In concept, this would be similar to computing heading between two receivers operating in RTK mode, with the associated accuracy.
The second method involves using GrafMov software, another NovAtel product from our Waypoint Products Group, to compute a moving-baseline solution between the two airborne receivers, in much the same way that ALIGN itself works. The added redundancy of having both forward and backward processing with an independent engine gives added confidence that we are likely to identify any major blunders.
In addition to the GrafMov/GrafNav ALIGN calculations, we have one further constraint on our data that serves as an excellent sanity check of the real-time ALIGN solution. With the antennas mounted on Andrew’s heels, the baseline length between them was constrained during free-fall to a maximum of roughly 90 centimeters by his wingsuit.
Given this knowledge, we can very easily identify any major blunders in the ALIGN solution when the baseline length is reported to be longer than this. So, even though we are operating without a true “fixed” baseline, we still have an absolute limit based on physical parameters that provides us with more opportunity to check our performance.
Step 4: Extracting
Accuracy Statistics
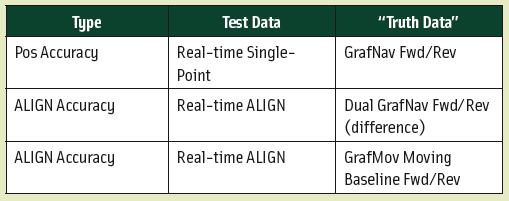
For both position and ALIGN data, we have assessed accuracy using a proprietary position analysis utility — a console-based application specifically designed to compare unit-under-test data points to either a fixed or moving “truth.”
In all, we compared several different versions of test data with the reference data output by both GrafNav and GrafMov:
Figure 1 (see figures at the top of this article) compares the jumper’s heading in real-time ALIGN versus GrafMov postprocessed results. The results have been filtered to show only data when real-time ALIGN is in fixed ambiguity mode. Note that the ALIGN trajectory is offset at right angles to the jumper’s heading as a result of the wingsuit setup and geometry (Figure 2).
Figure 3 compares the jumper’s real-time heading (purple data points) against results from two different postprocessed methods:
- GrafMov heading (green data points) was established by processing forwards and backwards through the data, with an independent processing engine from that used by the real-time ALIGN firmware.
- GrafNav (blue data points) shows two RTK trajectories calculated by processing forwards and backwards through the data, with the heading then computed from RTK position (right heel) to RTK position (left heel). This method produces statistically less accurate results than computing a relative heading.
Figure 4 compares the real-time ALIGN heading with that calculated by two types of postprocessing
software. (Results are filtered to show only data when real-time ALIGN is in fixed ambiguity mode.) Antenna separation between ALIGN Master and ALIGN Rover is approximately 60 centimeters on average.
The data indicate that the agreement between ALIGN and GrafMov is closer than ALIGN/GrafNav because the former heading is statistically more accurate than the GrafNav heading (based on two RTK positions).
Differences between GrafMov heading and ALIGN heading are as follows: <0.25° (50th percentile), <3.0° (90th percentile), <3.5° (95th percentile).
The heading “noise” appearing between 183 and 187 seconds is due to a high-dynamic turn that resulted in reduction in horizontal component of ALIGN Master-ALIGN Rover pair, which in turned decreased the heading accuracy.