 Figure 2: Sample Enlil Prediction
Q: How is solar activity predicted and how can predictions be used with GNSS?
A: Irregularities and turbulence in the ionosphere cause the largest errors imposed on GNSS applications. The ionosphere is created by the constant electromagnetic emissions from the Sun, and the largest disturbances in the ionosphere follow solar eruptions — flares and coronal mass ejections (CMEs).
Consequently, we need to know when eruptive solar activity is occurring, so that GNSS users can be aware of stressful times on their equipment and systems. Good awareness of conditions allows “workarounds” and re-scheduling for certain applications, plus, at a minimum, critical post-analysis of attempted work during the storm period.
Solar activity is predicted by analyzing recent and real-time solar data, acquired by space-based and ground–based instruments. The actual forecast process is very similar to the more familiar terrestrial weather prediction activities: taking data, ingesting the data into models, and then, after analysis and scrutiny by forecasters, formulating the actual predictions.
For solar activity, the process begins by gauging the state — both strength and complexity — of solar magnetic fields. The Sun is a magnetized star, and shows its deep-rooted field most simply in its well-known 11-year sunspot cycle.
Sunspots come and go and literally mark the presence of strong, local magnetic fields on the Sun. As the cycle waxes/wanes, the sunspot groups become more/less commonplace and also more/less energized. When more spots emerge, and then when they become unstable, their energy is released, manifesting itself in sudden explosions — solar flares — as well as more leisurely, but even more threatening, eruptions that are CMEs.
Taking the Sun’s Measure
To ascertain the level of magnetic instability and the potential for eruptive activity on the Sun, forecasters look at data from various layers of the solar atmosphere, and then merge it together to form a coherent picture of solar magnetic fields. The analysis — from inside out — actually looks at the sub-surface solar conditions as evidenced by helioseismology (i.e., the study of wave oscillations in the Sun).
By tracking sound waves from the front to the back of the Sun, and their return path, we can predict the locus of strong magnetic fields. Although the technique is still in a phase of development, it shows promise, particularly for longer-term predictions.
At the lowest visible layer of the solar atmosphere, data from the photosphere — sunspot configurations and magnetic field measurements — are taken. Higher still in the solar atmosphere, in the chromosphere, images in the Hydrogen-Alpha (H-alpha) band (656.3 nanometers) show hot spots and areas that are both dynamic and evolving, as well as bright and energetic. Typically these sites overlie sunspots and are a key element for forecasters making predictions of eruptive activity.
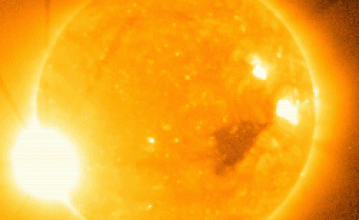
Figure 1 (see image at the top of this story) shows an example image of the Sun in the H-alpha band. The bright spots are called plage, lying above sunspots in the solar atmosphere. Plage are bright, indicating the stored magnetic energy therein.
When flares occur, the plages brighten spectacularly. The dark features are called filaments, a sign of relatively cooler material suspended high in the chromosphere. In profile at the “limb” of the Sun, these filaments are termed “prominences.”
At the top of the solar atmosphere is the corona, a very rarefied and hot gas that emits X-rays, extreme ultraviolet (EUV), and other radio wavelengths. Of particular interest for predictions of solar activity are images in X-rays and EUV, as they also show areas of strong magnetic fields and may even provide an early indication of the region being ready to erupt.
This composite picture of the Sun gives a sense of the current condition of the solar magnetic fields. The forecaster may then also check for any periodic behavior over the past few solar rotations.
During the maximum phase of the solar cycle — currently predicted to be around mid-2013, but will actually include the few-year period centered around that date — characteristic “active longitudes” will set up for a few months at a time. Eruptive activity will preferentially come from these solar longitude zones, creating a heightened probability of eruptions at certain times.
The Sun appears to rotate from Earth on a 27-day cycle; so, if an active longitude zone sets up, a week during a month may have a statistically greater likelihood of eruptions, even beyond what the day-to-day observations might suggest.
Modeling Space Physics
The next phase of the process involves invoking physics-based models. Compared to terrestrial meteorology, space physics modeling is still very far behind. The path set by the conventional weather modelers is the one on which solar activity modelers seek to follow. History shows that the introduction of numerical models in the terrestrial weather community a half-century ago enabled steady improvement in predictions.
Currently very few models exist that predict solar eruptions. However, a few models can estimate when a plasma cloud — a CME — will begin to affect the Earth environs after being launched from the Sun.
At the Space Weather Prediction Center, focused effort is now underway to bring a solar wind/CME model, dubbed Enlil after the Sumerian god of wind, online and operational. Enlil should improve on the current ability (with errors +/- 12 hours) to predict CME arrivals that initiate strong geomagnetic and ionospheric storms.
Figure 2 (see inset image, above right) is an Enlil graphic, a simulation of an actual CME that occurred in May 1997. The view is looking down on the ecliptic plane. The Sun rotates from left to right as seen from Earth, and drags its magnetic field along to form the Archimedian spiral shown here.
On top of that ambient solar wind spiral, the CME is plotted at a point in its radial path away from the Sun. It is shown as a reverse “C” shape due to the fact that the ambient flow is faster at higher latitudes. This particular CME is soon to envelope the Earth and cause a geomagnetic storm.
Eruptive space weather causes problems for GNSS in two ways: it causes more free electrons and associated turbulence in the ionosphere to alter and weaken GNSS signals as they pass through, and secondly, on rare occasions (most recently in December 2006), the solar radio noise emitted during a large flare can black out the GPS signal for a short period of time. The impacts of the December 2006 event were most acute for codeless and semi-codeless applications and only occurred on the dayside of the Earth.
Using Predictions for GNSS
GNSS users, then, should utilize the predictions for space weather as they plan their own activities. These predictions are available through the National Oceanic and Atmospheric Administration’s Space Weather Prediction Center (SWPC) here, as well as other partner centers affiliated through the International Space Environment Service.
In North America, Natural Resources Canada produces forecasts and warnings focused on the needs of Canadian users. In general, the methodology of making the forecasts is the same, but the products may be tailored to a particular country’s clientele.
The best predictions are for 24–72 hours. Solar flares and CMEs — the eruptive Sun — are clearly an important piece. Also, predictions of the state of the geomagnetic field are a focus of the forecasts. This aspect is very crucial for GNSS users.
Even though, literally, ionospheric storms are what affect GNSS, due to the tightly coupled system between the magnetosphere — the cavity in the solar wind that is carved out by the Earth’s main magnetic field — and the ionosphere, a disturbance in the magnetic field is strongly mirrored in the ionosphere.
In summary, forecasters study the Sun’s magnetic fields as they predict space weather. The space weather most problematic for GNSS users consists of solar flares and CMEs and then the subsequent storms that disrupt the ionosphere.
If history is any guide, new uses and refinements of GNSS applications will continue to spring up over the next 10 years. Space weather predictions must improve and provide continuing value to the GNSS community to keep pace with its technology. The fledgling space weather modeling efforts will help enable these improvements to occur, with the ultimate goal of giving GNSS users the information

