 Anechoic chamber test site at U.S. Naval Air Systems Command (NAVAIR) facility in Patuxent River, Maryland
Interference can pose a threat to the reception of GNSS signals in a variety of ways. Even low-level signals have the potential to interfere with GNSS receivers, which require very high sensitivity for acceptable performance due to the extremely low received GPS signal power at the Earth’s surface.
Interference can pose a threat to the reception of GNSS signals in a variety of ways. Even low-level signals have the potential to interfere with GNSS receivers, which require very high sensitivity for acceptable performance due to the extremely low received GPS signal power at the Earth’s surface.
Recently, a new potential interference threat has emerged and has attracted much attention in the United States and elsewhere. In January 2011, the U.S. Federal Communications Commission (FCC) granted satellite broadband provider LightSquared Subsidiary LLC a waiver to operate a terrestrial-only Long Term Evolution (LTE) network that would use L-band spectrum adjacent to the L1 frequencies occupied by GNSS.
The FCC’s waiver included a condition that the company must prove that its signals cause no interference to GPS. The commission set a June 15, 2011 deadline for LightSquared to submit a final report on the issue.
This very short timescale drove an urgent need for subject matter experts within the GPS community to form a GPS Technical Working Group (TWG). The TWG would appoint dedicated expert teams to conduct a comprehensive test campaign to investigate the potential for interference with all categories of GPS receivers. This was especially challenging because, with the exception of the cellular industry, few standardized industry approaches to GPS receiver performance testing exist, especially with regard to interference.
This article uses this test campaign, the methodology and results of which are now in the public domain, as a framework for discussion because it presents an ideal opportunity to review the methods used to quantify interference effects on GPS receivers, especially since the scope included the use of both live and synthesized laboratory signal environments.
Although this article explores these methods in the context of the LightSquared testing campaign, they are applicable to a much wider range of potential interference sources for GNSS. It is not intended to express an opinion on the part of the authors about the impact of LightSquared signals, nor on whether LightSquared should be allowed to deploy. It does, however, present a selection of the results from the TWG report, which was released on June 30, 2011, to illustrate the various methods employed and in particular to describe the value of laboratory testing.
The Cellular, General Location and Navigation, and High Precision Sub-Teams relied heavily on lab testing and it is the testing by these teams that forms the focus of the majority of this article.
The primary conclusions drawn by this article from this test campaign are:
(1) A number of industry-defined methodologies for testing the effects of GNSS interference have emerged, something lacking in the community up to this point.
(2) The laboratory-based testing methods employed to test GNSS interference clearly differentiate device performance and show how different interference presentations affect a representative population of devices.
(3) Multiple test approaches, including lab and live testing, are often needed to achieve conclusive results.
The authors describe the test approaches that have emerged from the TWG campaign, and provide insight into the different considerations used for selection of testing approach and analysis of the data obtained.
Overview of GPS Interference
Although spread spectrum signals themselves are inherently resistant to a wide range of in-band interference sources, the extremely low received power of a GPS signal increases its vulnerability to unintentional interference, such as spurious and out-of-band emissions. These can emanate from telecommunication and electronic systems that may be operating in adjacent bands or in bands relatively far from GPS bands such as FM/TV transmitter harmonics, AM transmitters, and mobile phone networks. Figure 1 illustrates the neighboring signals to GPS L1 and highlights the new potential interference source from LightSquared.
The LightSquared frequency plan has been presented in the 3GPP LTE Release 10 specifications, referred to as Band 24 in 3GPP TS 36.101 version 10.3.0. The downlink and uplink frequency ranges are 1525 MHz to 1559 MHz and 1626.5 MHz to 1660.5 MHz, respectively, and the band can accommodate both 5- and 10-megahertz RF channel bandwidths.
What has concerned the GNSS community especially is that until now the downlink band has been reserved for non-terrestrial Mobile Satellite Services (MSS) as shown in Figure 2, where spectral power densities in the typical operating environments for GPS are low. Current GPS receivers have not been designed with such a “noisy neighbor” to consider.
The downlink deployment scenarios planned by LightSquared are as follows:
(1) Phase 1: 5-megahertz LTE carriers at 1552.7 MHz and/or 1528.8 MHz 5-megahertz Low Only (F5L) 5-megahertz High Only (F5H) 5-megahertz Low + 5-megahertz High (F5L+F5H)
(2) Phase 2: 10-megahertz LTE carriers at 1550.2 MHz and/or 1531 MHz 10-megahertz Low Only (F10L) 10-megahertz High Only (F10H) 10-megahertz Low + 10-megahertz High (F10L+F10H)
There are three types of interference that could be associated with these signals:
(1) Out-of-band emissions that extend beyond their allocated frequency and leak into the GPS L1 band. LightSquared signals coming from terrestrial towers arrive at the receiver with a power level of up to -10 dBm while the mean GPS levels can be as low as -160 dBm. These extreme differences in power levels at the receiver imply very stringent filtering requirements at the LightSquared base stations.
(2) GPS out-of-band, or blocking, interference can result from an undesired response created by the mixing of an LTE signal with the local oscillator (LO) of a GPS receiver. The resulting undesired signals may be translated to the intermediate frequency (IF) stages as spurious response frequencies. Receiver front-end filtering can improve the blocking characteristics by reducing the level of the blocking signal (See Figure 2.) However, they may limit the effectiveness of certain receivers that have wide-band filters to take advantage of satellite-based GPS augmentation systems or to improve crisp code-chip edge detection.
(3) Intermodulation can desensitize a GPS receiver front end when third order intermodulation products created by non-linearities in the front end of a GPS receiver produce distortion products that land in or near the GPS band. This can be the case for the LightSquared F5L+F5H deployment scenario.
Live versus Lab Testing
The TWG test campaign included both lab and live (or field) testing — techniques that also play important roles in receiver development and verification.
A lab testing approach has the advantages of convenience and repeatability, enabling specific test conditions to be constructed and applied repeatedly to assess development progress, essential to those concerned with verifiable performance metrics. In the case of the TWG campaign, lab testing was used to reveal exactly how performance is affected as a function of LTE power, frequency and bandwidth.
Live testing is able to provide composite performance metrics, but is less capable at showing performance impact as a function of power. Other signals may also be present in the live environment that are not necessarily represented in the lab-testing environment. In contrast, lab testing strives to tightly control the environment to eliminate anything that could influence the repeatability of a test. Thus a complete evaluation of interference effects requires both lab and live testing to be conducted.
For the lab-testing component, the Cellular Sub-Team in the TWG testing looked to the performance metrics in the relevant 3GPP and 3GPP2 industry standard specifications. These standards were chosen because they are widely used and accepted in the industry, not because they focus specifically on GPS interference.
The 3GPP 34.171 and 3GPP2 IS-916 specification have long been accepted, by GSM/UMTS and CDMA operators respectively, as representing the minimum performance criteria that must be met by any device in order to operate in a network. In practice, device manufacturers strive for, and many operators demand, better performance than that dictated in these specifications.
The High Precision and General Navigation Sub-Teams did not have the benefit of industry-accepted standards to draw from in developing their lab testing approaches. As a result, new methodologies were defined and the metrics for, and definitions of, harmful interference were more challenging to identify. A common component of all sub-team lab tests was the introduction of the potential LightSquared LTE signal interferer, which was combined with GPS signals before presentation to the unit under test (UUT).
Lab Testing Overview
One valuable outcome of the TWG test campaign is a documented range of lab testing approaches and considerations for GNSS interference testing. These could form a useful reference point for any future attempts to harmonize interference test requirements across the industry.
Some of the most important considerations are discussed here to help compare and contrast the various approaches:
(1) Conducted versus over-the-air (OTA) RF testing
(2) Simulated versus recording and playback of RF signals
(3) Test results and key performance indicator (KPI) analysis
(4) Augmentation systems
(5) Test automation
Conducted versus OTA RF Testing. RF signals are presented to the UUT in a conducted or OTA manner. Conducted testing uses coaxial cables to feed signals directly to the device via an RF port, bypassing the device’s antennas. OTA testing radiates signals wirelessly to the device from an antenna into a controlled RF environment, which typically consists of an anechoic chamber and specialized equipment to precisely control signal levels, angle of arrival, and signal polarization and to suppress unwanted signal reflections. OTA testing accounts for the contribution of the device’s antenna and form factor but adds complexity and cost to the test setup.
A specific consideration with OTA GNSS Interference testing is that blocking signals frequently need to be radiated at a relatively high level to create an incident signal as high +10 dBm. Anechoic chambers have significant over-the-air transmission losses of the order of 40 to 60 decibels; so, powerful amplifiers and associated components are needed. This is not a problem with low-power GPS signals (typically in the –130 to –160 dBm power range).
When performing identical tests across a wide range of devices, it is desirable, whenever possible, to conduct them on multiple devices simultaneously as this is more efficient and aids comparison of results. For conducted testing this can be achieved using coaxial splitters and addressing any isolation issues. For OTA tests, antennas must be separated adequately and located such as to avoid cross-coupling and to ensure that the received signals are uniformly distributed across the array.
These factors dictate the size of anechoic chamber; the bigger the chamber, the greater the number of UUTs that can be tested simultaneously. For example, the TWG testing used chambers ranging from a single assisted-GPS (A-GPS) device within a 12x12x24-foot anechoic chamber to 57 high-precision GPS devices within a 40x40x100-foot chamber!
Simulated Versus Record and Playback of RF Signals. An essential aspect of lab testing is the generation of RF signals. For GPS blocking interference tests, at least two RF signal types must be generated: the GPS satellite signals and the blocking signal. The GPS signal generation can be accomplished through either simulation or a record and playback method.
A GPS simulator enables all elements of the test to be defined in a test case by the user, and then it synthesizes RF signals that are consistent with those GPS signal definitions, requested vehicle motion, and specified environment. Simulator testing allows receiver performance to be compared with a precise reference “truth,” enabling performance to be accurately quantified. The application of controlled changes, including in this case the LTE signals, enables evaluation of performance under a wider range of scenarios.
Record and playback GPS solutions adopt a fundamentally different approach: signals in a given RF band are digitally sampled and stored digitally for subsequent playback in the lab. A key benefit of this approach is that it enables the full rich, and perhaps chaotic, RF environment within the sampled band to be captured and replayed.
However, record and playback does not allow the test signals to be easily modified, and it provides limited insight into the exact nature of the sampled signal. Simulation and record and playback are generally complementary approaches and hence are often used together in a wide-ranging test plan.
For the TWG tests, the Cellular Sub-Team emulated the LightSquared (Band 24) LTE transmitter signals by generating them using an LTE Network Emulator, generating equal physical-channel power levels over all available resources to maintain a flat power spectral density (PSD) across the RF channel bandwidths. These signals were then captured using a vector signal analyzer for playback on a vector signal generator.
Other sub-teams used mathematical software tools to create a sampled LTE signal for subsequent playback on a vector signal generator. Because most signal generators are not able to generate a signal compliant with LightSquared’s proposed spectral mask, a representative bandpass filter was employed at the output of the vector signal generator.
Test Results and Key Performance Indicator (KPI) Analysis. The relevant performance metrics collected and reviewed by most sub-teams during the TWG lab test campaign were: carrier/noise ratio (C/N0), response time (also known as time to first fix, or TTFF), and position error. Although C/N0 proved to be a good metric for assessing and comparing the impact on GPS receivers as LTE signal power is increased, it is not a metric that an end-user would normally encounter. To understand real-world performance degradation, response time and two-dimensional (2D) position error are often more useful KPIs.
Augmentation Systems. The performance of many GPS devices is dependent on various augmentation systems. For example almost all mobile phones currently deployed in North America, require assistance data (e.g., satellite ephemerides, precise time, code phase, Doppler, and their associated uncertainties) when operating in A-GPS mode. High-precision receivers use commercial and other space-based augmentation services to provide correction data. In addition to GPS signals, lab testing requires these augmentation elements to support the normal operating modes of these devices.
A lab test system for A-GPS, for example, also requires a cellular network emulator to provide the cellular network signals that will transport the assistance data (which improves the GPS signal acquisition time and tracking sensitivity) to the device, whether they are CDMA, GSM, WCDMA, or LTE variety.
Also required is a serving mobile location center (SMLC) or position determination entity (PDE), which is the network entity that sources GPS assistance data. The SMLC or PDE must be tightly coupled to the GPS signal generator so that the simulated assistance data is consistent and accurate.
The cellular network connection also acts as a channel for location-specific messages or measurement data, allowing the location to be determined either in the network or the device itself. These messages and data can be mined for performance metrics by an automated test system.
Test Automation. Automation is often an essential element of lab testing, particularly when the scope and scale of tests is large. A challenge such as the LightSquared TWG testing with its aggressive timelines would be impossible without it. The benefits of automating the testing include:
- Greatly reduced test times
- Elimination of regular human intervention with the test system, offering reduced error and uncertainty
- High repeatability: a typical test algorithm involves cycling through various GPS satellite scenarios and sweeping through a range of blocking signal levels while recording the data generated. All these elements benefit substantially from application of automation.
A-GPS Cellular Device Testing
Testing of A-GPS cellular devices in the lab can make use of conducted or OTA test configurations. Figure 3 and Figure 4 illustrate the conducted and OTA test configurations used for TWG Cellular Sub-Team testing, described in the May 15 status report to the FCC described in the Additional Resources section near the end of this article.
Testing subjects the GPS receiver in a UUT to high-power LTE Band 24 signals by conducted injection or by OTA injection in an anechoic chamber. For the OTA testing, the GPS and LTE interferer signals are presented at the same transmit horn to ensure alignment with existing industry-standard anechoic chamber test methodologies and to maintain an acceptable measurement uncertainty limit.
The interfering signals are emulated using signal generators. Care was taken to ensure consistency with LightSquared’s base station emission mask by using representative transmit filters in the test setup.
In order to assess the level of interference, it is necessary to find the point of failure when a change or degradation in the user experience is deemed harmful, based on analysis of key performance indicators (KPIs). To accomplish this, testing can be performed in accordance with industry technical standards. The standards used during the TWG GPS Cellular Sub-Team testing were:
- 3GPP TS 34.171 for UMTS and GSM UUT’s
- 3GPP2 IS-916 for CDMA UUT’s
- CTIA Test Plan for Mobile Station Over the Air Performance, Version 3.1
The test objectives addressed multiple representative use cases:
(1) Testing at the GPS sensitivity limits of the devices, representative of indoor or other highly-obscured settings
(2) Testing at intermediate received GPS levels (with equal signal strength from all space vehicles or SVs) to evaluate performance in indoor, dense urban outdoor, or other environments with significant blockage and reflection of GPS signals
(3) Testing at strong received GPS signal levels corresponding to outdoor usage with relatively open-sky conditions (around -130 dBm)
To fulfill the objectives of the tests, the sub-team identified tests from the industry standards referenced earlier that mapped to these use cases, and which were then executed without interferers (baseline) and with varying interferer signal levels. Other desirable test activities, which were not undertaken due to the exceptionally tight time constraints, included simulation of multipath and the playback of recorded real-world data.
LTE interferers were presented at various levels ranging from 0 dBm to –55 dBm to determine the effect on the GPS receivers. Significant innovation — including use of control software to automate the testing — was required to create efficiencies that allowed testing of the maximum number of devices in the limited time period available.
Fortunately, time spent at an early point in the proceedings on optimizing the use of industry-standard test solutions enabled the sub-team to test all devices for the cases deemed to be high priority.
Initial testing focused on LightSquared’s planned Phase 1 downlink spectrum, as described in the earlier section, “Overview of GPS Interference.” This scenario has the potential to generate the highest power density adjacent to the radionavigation satellite system (RNSS) band in which GPS and other GNSS systems operate and can create third-order intermodulation (IM) products in the GPS receiver at the GPS L1 frequency.
Testing was performed with 5-megahertz LTE carriers separately and together to detect third-order IM products. Later testing focused on a deployment scenario with a single 10-megahertz LTE carrier centered at 1531 MHz.
The following KPIs were used to measure the effects on the UUTs: 2D position error, response time (TTFF), and C/N0, together with other metrics reported by the GPS receiver, such as absolute and relative code phase error and Doppler error, that can ultimately affect network-computed location.
To illustrate how these metrics are meaningful, the GPS Nominal Accuracy test (sections 2.4.1.4 and 2.4.2.4 from the TWG test plan) provides a view of how the LightSquared base station transmission will affect the GPS receiver when the eight SVs’ signals are at the 3GPP/3GPP2 required accuracy level of – 130dBm.
Figure 5 depicts how the LightSquared base station transmission affects the GPS receiver’s ability to pass the GPS accuracy test under strong SV signal strength conditions. Figure 6 shows how the actual GPS location accuracy was affected for those devices that passed the test.
These charts show location error with and without the LightSquared blocking signal is roughly equivalent to the 1-sigma noise, which is small in absolute terms but rather large as a percentage. Further, the delta error is inversely correlated with the nonblocker location error; for a receiver that makes better measurements, the blocker appears to show a greater degradation, both absolute and relative.
Figure 6 shows the performance of the devices using nominal accuracy tests required by the FCC, under the different blocker levels proposed by the phase I and phase II LightSquared plan.
Figure 7 is a representation of the performance when the lower 10-megahertz signal was present for the complete set of standardized tests that largely drive E-911 compliance.
General Location/ Navigation GPS Device Testing
The General Location/Navigation Sub-Team created a test plan for evaluating the effects of LightSquared transmissions on GPS receivers that spanned categories such as Fitness, Wilderness Navigation, Marine, Personal Navigation Devices, Emergency Vehicle, Fleet Management, and Portable Aviation devices. All of these operated in the GPS L1 band.
Tests were radiated in an RF Chamber at two facilities (see Figure 8), each of which was capable of testing one device at a time.
The primary metric used to analyze performance was C/N0 degradation reported by the GPS receiver and recorded on a communications monitor provided by each equipment manufacturer. The objective of the testing was to identify the power level of the simulated LightSquared LTE signal that caused each device to degrade 1dB, 3dB, 6dB, 10dB, and 20dB from the baseline for each test scenario. The baseline was defined as the average C/N0 reported by devices with no LTE blocking signal present.
The test methodology from this group was particularly interesting in that it tested both static and dynamic scenarios, i.e., a mobile UUT compared to one that remains at a single point. Dynamic tests are more realistic but also more complex to implement.
Static tests are very useful for measuring metrics such as C/N0 degradation. Table 1 contains example results from Appendix G.21 that show device susceptibility to a 10-megahertz blocking signal at 1531 MHz for a static scenario.
The dynamic tests performed by this group employed both the simulated GPS and the record and playback GPS approaches previously discussed in the “Lab Testing Overview” section. Details of these scenarios can be found in Appendix G.1 (General Location and Navigation Test Plan) of the TWG Final Report.
The simulated dynamic scenario used six satellites with a rectangular device motion trajectory, very similar to that used in GNSS industry-standard device performance tests2.
- Several record and playback dynamic scenarios were used:
- Suburban Use Case – UUT mounted to dash of vehicle driving in suburban, tree-lined, environment
- Urban Canyon Use Case – UUT mounted to dash of vehicle driving on road with tall buildings on both sides
- Deep Forest Use Case – UUT held in hand while walking in forest
- Fitness Use Case – UUT mounted on arm while running
These dynamic use cases (both simulated and record/playback) create very realistic GPS conditions, yielding performance metrics that map closely to those seen in the real world. At the same time, the GPS signals can be presented to the UUTs repeatedly, in exactly the same way, allowing performance to be accurately analyzed for many devices, with different power levels of the LightSquared LTE signal.
These dynamic tests collected the following metrics as reported from each device every second (i.e., 1-hertz intervals):
- latitude, longitude, and altitude
- velocity
- time
- C/N0 for each satellite
One of the primary presentations of results from the TWG report was an overlay of 2D position performance for devices at baseline versus 1dB, 3dB, 6dB, 10dB, and 20dB C/N0 degradation. Figure 9 shows an example where 2D positioning performance is greatly compromised when exposed to 5-megahertz LTE blocking signals at 1552.7 MHz and 1528.8 MHz, with power levels that result in 20-decibel degradation in C/N0 measurement.
The General Location and Navigation Sub-Team also conducted tests for acquisition sensitivity, TTFF, and the U.S. Wide Area Augmentation System (WAAS) demodulation. The methods for presenting GPS and LightSquared LTE blocking signals remained the same for these tests, but the test sequence and reported metrics changed. More details can be found in Appendix G.1 and G.2 in the TWG Final Report.
High Precision GPS Lab Testing
High precision receivers are used extensively in the areas such as construction, agriculture, mining, and structural deformation, as well as in timing applications. The requirements for testing the effects of Interference on high-precision GPS receivers and those for timing applications differ somewhat from those for mass-market and general navigation GPS devices in a number of areas.
In general, high-precision and timing receivers have much wider bandwidth front-ends in order to extract the maximum amount of information from the GPS signals. They typically track the wider-bandwidth GPS P(Y)- code signal at both L1 and L2 frequencies and rely heavily on carrier phase measurements rather than simply C/Acode phase.
Many receivers in this category operate in modes other than standalone, employing real-time kinematic (RTK) techniques and augmentation from the likes of WAAS or commercial satellite-based augmentation systems (SBASs). Indeed, the latter operate within the same MSS band as the planned LightSquared deployment and could suffer from interference themselves, whereas WAAS operates at the GPS L1 band center frequency, 1575.42 MHz.
Further complexity is introduced by the fact that RTK employs both base station and rover receivers, creating test cases where both, one, or none are subject to the interference source. As a result, receivers of this type tend to be more prone to interference across and near to the range of L-band frequencies in which they operate.
The number and scope of the test cases required by the high-precision test plan were therefore fairly large and had an estimated total duration of more than 67 hours, not including setup times between tests. Performing these tests sequentially for each receiver sample was not considered practical, given the compressed timeline for completing the test program, even though all the scenarios had been fully automated via custom control scripts.
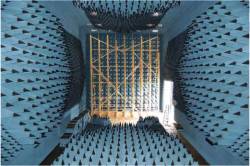
As a result, the sub-team decided to test all samples simultaneously in a very large anechoic chamber hosted by the Facilities for RCS and Antenna Measurements (FARM) at the U.S. Naval Air Systems Command (NAVAIR) facility in Patuxtent River, Maryland. In common with many of the test working groups, a GPS simulator was used as the GPS signal source, although in this case it offered C/A-code and P(Y)-code signals at GPS L1 and P(Y)-code at L2.
The GPS simulator used in these tests was able to deliver a P(Y)- code signal that is P-code but encrypted with an unclassified public-domain model of the actual encrypting code, enabling these receivers to operate in their normal wideband tracking mode.
Two vector signal generators were employed, not only to represent the LTE base-station signals but also to test for the effect of LTE device transmissions in the proximity of a high precision receiver.
Finally, generators were needed for the augmentation signals. WAAS signals were not used because it was decided that any effects would be similar to GPS.
The chamber employed measures 40x40x100 feet and is equipped with a 3×3 foot transmit window halfway up one of the 40-foot walls for transmission of the GPS and /commercial SBAS signals. The accompanying photo shows the wooden UUT antenna support frame as viewed from the transmit window.
The LTE signals were transmitted from pole-mounted antennas within the chamber adjacent to the transmit window, at the same elevation as the other signal sources. For RTK testing, rover or base-station receivers could also be stimulated outside the chamber by the GPS simulator. A block diagram of the installation is shown in Figure 10.
The field strength at the UUT test site for LTE signals generated through a linearly-polarized horn was calibrated using a network analyzer at five locations across the array to ensure linearity, which was within ±3 decibels. Using the distance and the chosen path loss models, the appropriate effective distance from transmitter to UUT could be established for the particular test case. The two LTE signals were transmitted with orthogonal polarizations to minimize coupling. For GPS signals a baseline C/N0 ratio was extracted from a representative UUT.
During all tests, the UUTs were required to continuously record a wide range of raw performance data for subsequent off-line analysis by the manufacturer. As a minimum this included pseudorange, carrier phase, Doppler and C/N0 ratio, but in some cases was also supplemented by tracking variances, signal quality, and the packet error rate (PER) of the augmentation signals.
As the tests were all conducted with the UUT at a simulated static location of N38o15’, W76o25’, it was also possible to record position accuracy in standalone and RTK or augmented modes, as well as pseudorange, Doppler accuracy, and several other parameters relevant to this class of receiver.
A nominal 24 satellite constellation was employed in the GPS simulator, derived from ICD-GPS-200C. Test cases were designed to stimulate receivers in respect of four generic KPIs, namely “Tracking,” “Reacquisition,” Sensitivity,” and “Acquisition.”
In all cases the tests were repeated for each of the six identified LTE downlink signal deployment scenarios described in the “Overview of GPS Interference” section earlier. Additionally, the transmission of uplink LTE signals from a device was explored as a seventh scenario.
For tracking, the test principle was to ramp the LTE interfering signal from minimum -70 dBm to +10 dBm maximum in one-decibel steps with an interval of 60 seconds followed by a two minute dwell time before ramping back down to the -70dBm level at the same rate.
For reacquisition, the test principle was to determine the reacquisition time of the receivers at various levels of LTE signal strength, starting with the minimum and increasing to the maximum in five-decibel intervals. A baseline was established with the LTE signal switched off. At each LTE level, the GPS signal was switched off for 10 seconds after tracking had been established for at least 60 seconds.
The sensitivity test was similar to that of the reacquisition test, but instead of switching off the GPS signals at each of the LTE levels, they were reduced by 15 decibels from their nominal level at a rate of a one-decibel step each minute before returning to the nominal level.
Finally, for the acquisition test, after 5 minutes of nominal GPS conditions from power-on, receivers were warm started repeatedly (a minimum of four times) over a 15-minute period with the LTE signal off in order to establish baseline data. The test was then repeated at LTE levels from minimum to maximum but with a 10-decibel interval.
Inevitably, with such a short time available to organize such complex test scenarios across a wide range of UUTs, a number of compromises had to be made against the original test plan.
The first of these was augmentation signal fidelity. To be useful, augmentations must contain data consistent with the GPS signals that they augment and suitable data was available from the simulator. However, only dummy packets could be transmitted as these commercial systems use a proprietary format. The receivers would naturally reject these packets, and thus only standalone modes could be tested.
However, by measuring the PER and energy-per-bit (Eb/No) obtained, this technique was valuable in assessing reception of the augmentation signal itself in the face of the LTE signal. Secondly, no attempt was made to compensate for the lower path loss of radiated signals at L2 when compared to L1.
Finally, during device-based interferer testing, the LTE transmission filter used was not fully representative of those likely to be employed in actual devices, yielding results that would probably be slightly worse than if a better filter were used.
In all, 57 high precision receivers were tested in the chamber, of which 13 were timing receivers. The final report used data from 48 of these receivers, including 14 timing units.
Receiver manufacturers were given the task of translating the test conditions into equivalent operational scenarios and then analyzing the associated data gathered from these scenarios to determine the likely operational effects. For this purpose they would apply two propagation models: a simple square-law free-space model and a more complex WILOS (Walfisch Ikegami Line Of Sight) model.
KPIs employed in the analysis encompassed the 10, 50, and 90 percentiles for:
- One-decibel drop in L1 C/N0
- Loss of satellite lock
- One-decibel drop in L2 C/N0
- Maintain acceptable position
- Maintain acceptable RTK solution
- Maintain GPS lock (Timing)
- Sensitivity degradation
- Acquisition degradation
- Reacquisition degradation
In each case, the tests identified the divergence point from nominal operation, which represents the level at which the interferer began to have an effect
Figure 11 shows a summary of the divergence point KPIs for the chamber tests.
To illustrate how to interpret this table, consider the top left cell. The data indicate that 10 percent of the receivers tested exhibited a drop in L1 C/N0 with the F5H LTE signal at –82dBm. Any zeros in the table indicate that the condition was not observed.
The equivalent data for timing receivers is shown in Figure 12. The divergence points were determined from the curves similar to those shown in Figure 13.
Conclusion
GNSS vulnerability, and the specific procedures and test methodologies that help quantify the impact of other signals, is an important topic in today’s world. More coexistence issues such as those that have arisen from the proposed LightSquared terrestrial LTE network deployment can be expected, and may even be inevitable, given the pressure for ever more spectrum allocation that is driven by an explosion in demand for mobile broadband.
The case for developing a sound and comprehensive test strategy for GNSS interference is simple:
(1) The effects of emerging signals need to be accurately understood as early as possible to avoid controversy late in the process, such as we are seeing today, and
(2) any mitigation techniques that may be required need to be well characterized in controlled environments to understand performance tradeoffs so that the next generation of GNSS equipment is both resilient and economical.
The LightSquared TWG test campaign, designed by industry leaders, has clearly shown the value of lab-based testing in quantifying the effects of interference on GPS and it represents a potential basis for an industry-wide consensus on a standardized approach to GPS performance testing. Differences in performance across devices and interferer presentations have been shown to be clear and repeatable. When combined with results from live testing, the results from lab testing have made tangible conclusions possible and enabled important decisions to be made.
More (much more!) information can be found in the TWG Final Report, and the experts at Spirent and Judge Software Systems would be pleased to help answer questions.
Additional Resources
[1] Borio, D., and L. Lo Presti, D., Odijk, G. Lachapelle, and M. Petovello, “Mathematical Models and GNSS Interference,” GNSS Solutions column, Inside GNSS, March/April, 2008
[2] Federal Communications Commission, Deere submission: LightSquared Interference to GPS and StarFire, May 26, 2011
[3] Federal Communications Commission, LightSquared Technical Working Group status report, Washington, D.C., May 15, 2011
[4] Federal Communications Commission, LightSquared Technical Working Group final report, Washington, D.C., June 30, 2011
[5] Foegelle, M., and R. Borsato, H. Alparslan, and B. Butler, “Over-the-Air Test Method: A-GPS Antenna Performance,” GPS World, September 2009
[6] Petrovski, I., and B. Townsend and T. Ebinuma, “Testing Multi-GNSS Equipment: Systems, Simulators and the Production Pyramid,” Inside GNSS, July/ August 2010
[7] Petrovski, I., and T. Ebinuma, “GNSS Simulators, Part 2: Everything you wanted to know…but were afraid to ask,” Inside GNSS, September 2010
[8] Petrovski, I., and T. Tsujii, J.-M. Perre, B. Townsend, and T. Ebinuma, “GNSS Simulation: A User’s Guide to the Galaxy,” Inside GNSS, October 2010