
GNSS technology plays an important role in an ever expanding range of safety, security, business and policy critical applications.
Many parts of critical infrastructures rely on uninterrupted access to GNSS positioning, navigation and timing services, but, at the same time, threats to denial of GNSS services are increasing. Radio frequency interference can be unintentionally emitted by commercial high power transmitters, ultra-wideband radar, television, VHF, mobile satellite services and personal electronic devices. Moreover, malicious intentional interference is produced by jammers, whose rapid diffusion is becoming a severe threat to GNSS.
To ensure GNSS is protected, there is now a need to respond at an international level to ensure that there is: i) a common standard for real-world GNSS threat monitoring and reporting, and ii) a global standard for assessing the performance of GNSS receivers and applications under threat. GNSS threat-reporting standards would allow for compilation of real-world threats into a database that could be analyzed to develop GNSS receiver test standards that ensure new applications are validated against the latest threats. Both standards are missing across all civil application domains and are considered a barrier to the wider adoption and success of GNSS in the higher value markets.
This article discusses the STRIKE3 project that was specifically developed to address the issues outlined above.
STRIKE3 Overview
The STRIKE3 (Standardizsation of GNSS Threat reporting and Receiver testing through International Knowledge Exchange, Experimentation and Exploitation) project is a European initiative that addresses the need to monitor, detect and characterize GNSS threats to support the increasing use of GNSS within safety, security, governmental and regulated applications. STRIKE3 has deployed an international network of GNSS interference monitoring sites that monitor interference on a global scale and capture real-world threats for analysis and to ultimately test GNSS receiver resilience.
Using thousands of threats collected from their network over a three-year period, STRIKE3 has developed a baseline set of threats that can be used to assess performance of different GNSS receivers under a range of typical real-world interference/jamming threats. The resulting specification consists of five different threats: wide swept frequency with fast repeat rate, narrow band signal at L1 carrier frequency, triangular and triangular wave swept frequency and tick swept frequency. For details of how these five threats were selected, refer to the Additional Reading section at the end of the article.
Finally, the STRIKE3 project has begun using its test specification to test receiver performance in the presence of various threats. Below is a discussion of how this is done as well as some results for a specific type of interference.
Collectively, the above activities aim to improve mitigation and resilience of future GNSS receivers against interference threats.
Receiver Testing
The main objectives of the testing component of the STRIKE3 project are: first, to validate the proposed testing standards to demonstrate they are clearly defined, useful, and practical; and second, to assess performance of a variety of receivers against real-world threats detected by the STRIKE3 monitoring network. Using real-world threats detected at the monitoring sites enables interested stakeholders (e.g., certification bodies, applic
ation developers, receiver manufacturers, etc.) to better assess the risk to GNSS performance during operations and to develop appropriate countermeasures.
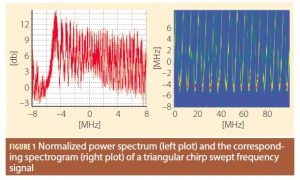
The remainder of this article presents some illustrative examples for multi-GNSS mass-market and professional grade receiver testing against a single interference type that is very commonly detected at STRIKE3 monitoring sites, namely a triangular chirp swept frequency signal as depicted in Figure 1.
The test platform used is shown in Figure 2. The clean GNSS signal is generated from a multi-constellation, multi-frequency Spectracom GSG-6 hardware simulator, whereas the threat signature is generated using a Keysight Vector Signal Generator (VSG) N5172B through the replay of raw I/Q (In-phase/Quad-phase) sample data. Raw I/Q data captured in the field for a real-world event is used as input to the VSG which then re-creates the detected threat by continuously replaying the data in a loop.
Both the GNSS signal simulator and the VSG are controlled via software in order to automate the testing process. The automation script is used to control these devices remotely and to limit human intervention. The script also provides synchronization between the two instruments in order to ensure repeatability of the tests and the reliability of the results.
The clean GNSS signal and the interference signal are combined using an RF combiner, and the interferencecontaminated GNSS signal is fed to the Receiver Under Test (RUT), which produces its own output metrics. For the validation of
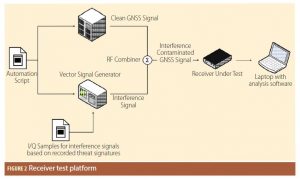
baseline performance under nominal signal conditions, the VSG does not generate any interference signal. In this case, the input signal to the RUT is only the clean GNSS signal produced by the GNSS constellation simulator.
A laptop is used to record and analyze the performance of the receiver against the different threat signals. The analysis is performed using a MATLAB-based script that processes the NMEA output messages from the RUT.
For each receiver category — namely mass-market and professional grade — three different test methodologies are performed:
- Baseline – a clean GNSS signal in the absence of interference is fed to the RUT to validate its performance under nominal conditions. The total duration of this test is 60 minutes.
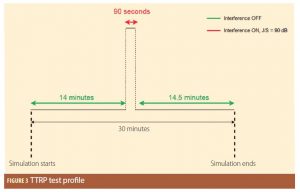
- Time To Re-compute Position (TTRP) solution – this test is used to measure the time taken for the RUT to recover after a strong interference event. In this test, the interference is switched on 14 minutes after the simulated scenario starts and it is applied for 90 seconds. The interference power is fixed to a value such that the receiver immediately loses its position solution. In this test case scenario the interference power corresponds to a Jamming-to-Signal (J/S) ratio of ~90 dB. The time taken between switching off the interference source and the first position fix is recorded as the TTRP. The profile of this test
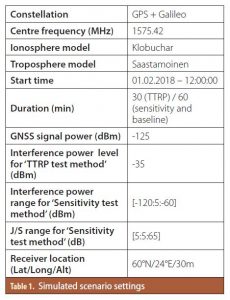
Table 1 methodology, whose total duration is 30 minutes, is illustrated in Figure 3.
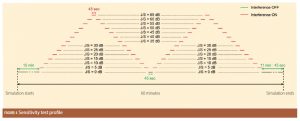
- Sensitivity – this test scenario is conducted by varying the power of the interfering signal. The interference is turned on 10 minutes after the simulation starts and it follows a two-peak ramp power profile. The initial interference power is such that J/S is ~5 dB, and then the interference power is increased by
5 dB every 45 seconds until reaching a J/S of 65 dB. After the first peak has been reached, the interference power is decreased in a reverse manner. The power profile is then repeated a second time. The profile of this test methodology is illustrated in Figure 4.
In order to assess the performance of the RUT in the presence of interference, different metrics were selected. The following outputs from the GNSS receiver are recorded and analyzed for all the test methodologies:
- Number of tracked satellites
- Position fix indicator (a Boolean to indicate if a 3D position fix is available or not)
- Number of satellites used in fix
- Carrier-to-Noise density (C/N0) ratio
- East-North-Up position error
Moreover, depending on the test methodology, additional parameters are evaluated. For example, in the case of the TTRP test method, the time tak
en for the RUT to re-obtain a position fix after a strong interference event is measured. For the sensitivity test method, the Jamming-to-Signal ratio at which the position solution is no longer available and the availability of the position solution during the interference event are computed. Furthermore, position accuracy statistics are computed for the interval in which the interference is present when the receiver offers a valid position fix.
Currently, only GPS L1 and Galileo E1 signals are used for testing and the RUT is configured to operate in static stand-alone mode.
Table 1 provides an overview of the simulated scenario settings, including the receiver location, the start time, the duration, the GNSS signal power and the interference power levels for the different test methodologies.
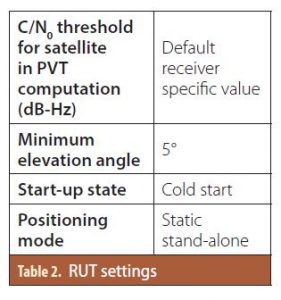
When performing the tests, an elevation mask of 5° is applied for the Position, Velocity and Time (PVT) computation. The RUT’s default C/N0 mask is used in all cases. The RUT settings are summarized in Table 2.
Results
This section presents the results of the standardized tests of a mass-market and a professional grade receiver against one of the most frequently detected interference types at STRIKE3 monitoring sites. The spectrum and the spectrogram of such interference signal are sho
wn in Figure 1.
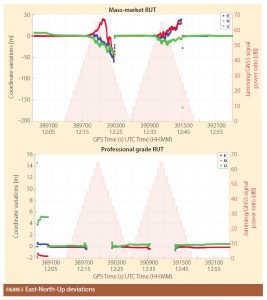
The accuracy and availability of the receiver’s position solution during the interference interval is analyzed in the sensitivity tests. As the interference power increases, the receiver performance continues to degrade and at some point the RUT loses the position fix. The East-North-Up (ENU) deviations of the position solution for the mass-market (top) and the professional grade receiver (bottom) are shown in Figure 5.
Both receivers offer inaccurate position solutions in the beginning, especially in the vertical component. This is due to the cold start and the resulting unavailability of ionospheric parameters, and to the convergence of the navigation filter.
It can be seen that the mass-market RUT prioritizes the availability of the position solution over its accuracy. In particular, during the interference interval, there are only a few epochs at which the receiver does not yield a solution, but this high yield comes with degraded positioning accuracy.
On the other hand, the professional grade RUT prioritizes the accuracy over the availability. It does not offer the position solution as often during the interference interval, but when it does the position errors are minor.
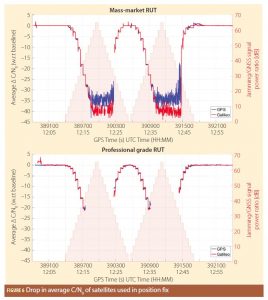
In order to have a better understanding of the interference impact on the RUT, a comparison with respect to the baseline test case is also carried out. Figure 6 shows the drop in the average C/N0 of the satellites used in position fix with respect to the baseline for the entire duration of the test. As expected, in the presence of interference, the signal quality worsens as the interference signal’s power increases. Given the wideband nature of the interfering signal, GPS and
Galileo are affected similarly.
The difference between the mass-market and the professional grade receivers’ behavior is also visible here. While the former continues to use very low quality signals in order to provide a position solution, even if inaccurate, for as long as possible, the professional grade RUT stops computing the solution when the signal quality decreases by about 20 dB.
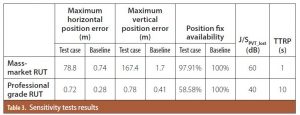
A summary of the results is given in Table 3. The maximum horizontal and vertical errors are computed for the interval in which the interference is present when the receiver offers a valid position fix. As already discussed, the position fix availability during the interference interval for the mass-market receiver is high at the expense of position accuracy. On the other hand, the professional grade RUT preserves the position accuracy at the expense of solution availability: the maximum horizontal and vertical errors in the test case are only slightly larger than in the baseline case.
The J/S at which the position solution is no longer available, J/SPVT_lost, is also determined. It can be observed from Table 3 that the mass market RUT has much higher sensitivity as compared to professional grade RUT, when manufacturer’s default receiver settings are used. Finally, it can be observed that TTRP values are much better for mass-market RUT than professional grade RUT.
Conclusion
Given the increasing dependence on GNSS technology and its vulnerability to intentional and unintentional interference, it is important to understand the magnitude and evolution of the GNSS threat scene. The STRIKE3 project is addressing this need through the development of monitoring and reporting standards, the deployment of a worldwide monitoring network to test the reporting standards and to provide a database of real-world events, the development of receiver testing standards against threats, and an intensive testing activity against the detected real-world interferences in order to test the resilience of different multi-GNSS receivers.
Additional Reading
For more details on the European H2020 project ‘STRIKE3’, please refer to: STRIKE3 (2016) Standardizsation of GNSS Threat reporting and Receiver testing through International Knowledge Exchange, Experimentation and Exploitation [STRIKE3]. http://www.gnss-strike3.eu/.
For more details on STRIKE3 proposed GNSS threat reporting standards, please refer to: Thombre, S., Bhuiyan, M. Z. H., Eliardsson, P., Gabrielsson, B., Pattinson, M., Dumville, M., Fryganiotis, D., Hill, S., Manikundalam, V., Pölöskey, M., Lee, S., Ruotsalainen, L., Söderholm, S., Kuusniemi, H. (2017) “GNSS Threat Monitoring and Reporting: Past, Present, and a Proposed Future”, The Journal of Navigation 71(3):513-529.
For more details on draft standards for receiver testing against threats, please refer to: Pattinson, M., Sanguk, L., Bhuiyan, M. Z. H., Thombre, S., Manikundalam, V., Hill, S. (2017) “Draft Standards for Receiver Testing against Threats”, available online via: http://www.gnss-strike3.eu/.
Authors
Nunzia Giorgia Ferrara is a Research Scientist in the Department of Navigation and Positioning at the Finnish Geospatial Research Institute and a PhD candidate at Tampere University of Technology where she was a Marie Curie Fellow from 2014 to 2016. Her research focuses on multi-GNSS receiver design and interference detection and mitigation.
Dr. M. Zahidul H. Bhuiyan is working as a Research Manager at the Department of Navigation and Positioning in the Finnish Geospatial Research Institute. He is also serving as the head of the Satellite and Radio Navigation research group of the institute. His main research interests include various aspects of multi-GNSS receiver design, GNSS vulnerabilities, SBAS, differential GNSS, etc.
Amin Hashemi is a Research Scientist with the Navigation and Positioning department of the Finnish Geospatial Research Institute. His current focus is on
localizing GNSS interference sources.
Dr. Sarang Thombre is a Research Manager and Deputy Leader of the Satellite and Radio Navigation research group at the Department of Navigation and Positioning of FGI. He earned his Ph.D. degree in April 2014 from Tampere University of Technology, Finland. His research interests include GNSS receiver design and implementation, autonomous vehicle PNT techniques, and RF interference to GNSS.
Dr. Michael Pattinson is a Principal Navigation Engineer at NSL and jointly leads the Safety and Integrity business unit. His main activities include advanced position techniques (high accuracy and high integrity), as well as GNSS performance monitoring and anomaly investigation to enhance GNSS robustness and reliability.